
Fig. 4.
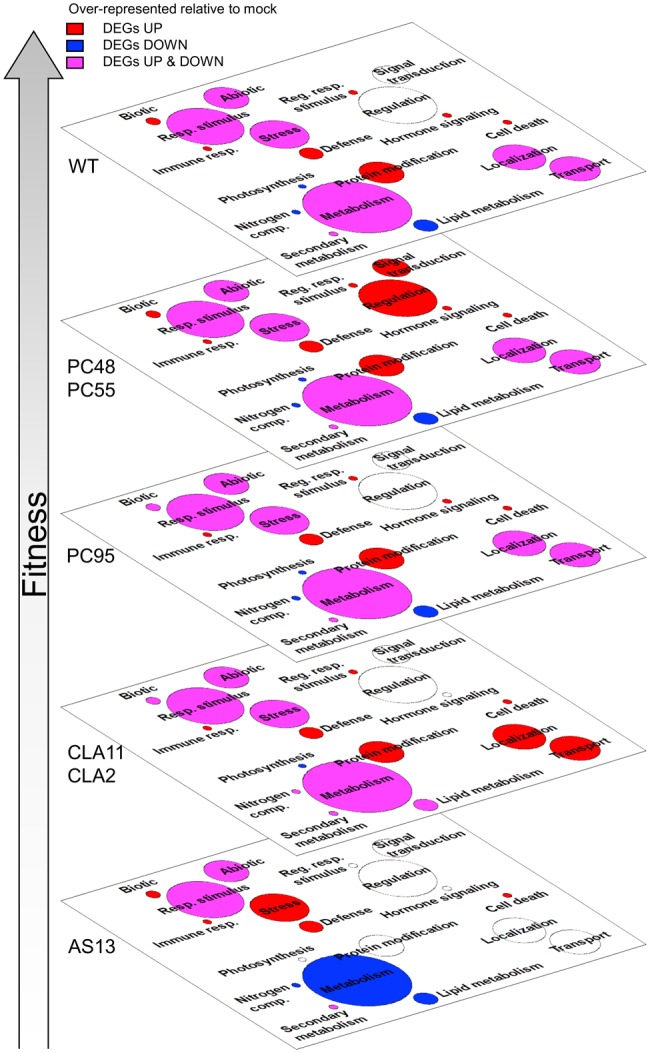
Functional analysis associated to differential gene expression. Artwork of meaningful biological processes (in a plane). Categories that are overrepresented in the two lists of DEGs for each TEV genotype (up- and down-regulated), either in one of them or in both, are indicated with different colors. In red, we represent categories that are significantly enriched by up-expressed DEGs, in blue categories that are significantly enriched by down-expressed DEGs, and in pink categories enriched in both types of DEGs; the surface of each circle is proportional to the number of DEGs included in each category. Enrichments were evaluated by Fisher’s exact tests with FDR (adjusted P < 0.05). The different planes are organized according to viral fitness. We considered infected versus mock-inoculated control plants (For interpretation of the references to colour in this figure legend, the reader is referred to the web version of this article.).