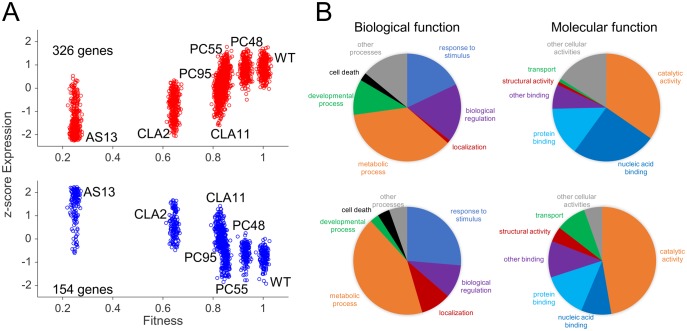
Fig. 5.
Association between TEV fitness and plant gene expression. (A) Correlation plots between host gene expression and viral fitness for those genes that significantly vary across all viral infections (one-way ANOVA with FDR, adjusted P < 0.05), and that exhibit a significant positive (upper panel; red dots) or negative (lower panel; blue dots) trend (Spearman’s correlation test, P < 0.05). Expression data represented as z-scores. (B) Pie charts of biological and molecular functions. On the top, for genes whose expression increases with TEV fitness (red dots in panel A); on the bottom, for genes whose expression decreases with fitness (blue dots in panel A). (For interpretation of the references to colour in this figure legend, the reader is referred to the web version of this article.).

