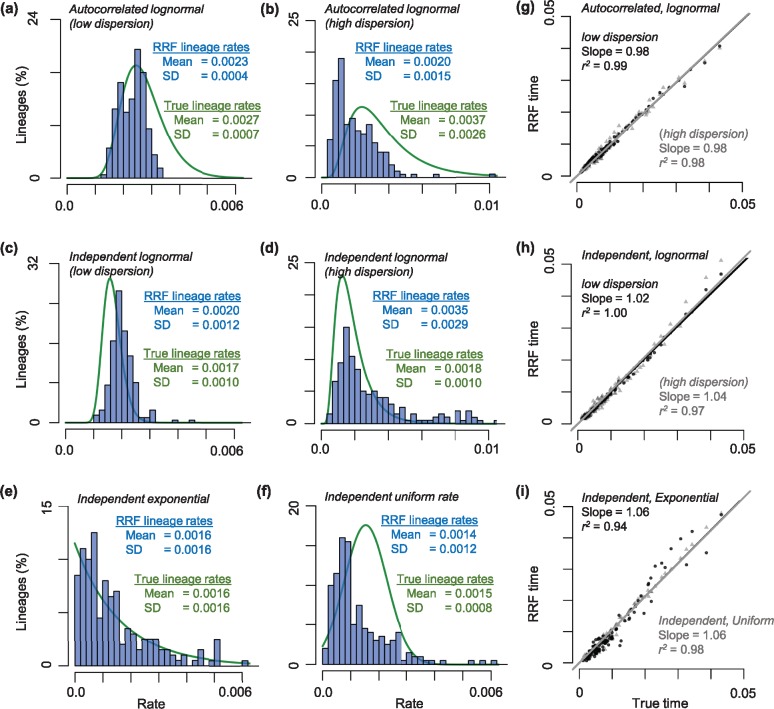
Fig. 8.
Distributions of true and RRF-derived estimates of lineage rates. Branch rates were simulated under autocorrelated lognormal rate models with (a) low and (b) high dispersions, independent lognormal rate models with (c) low and (d) high dispersions, and independent rate models with (e) exponential and (f) uniform distributions. Green lines represent the fitted curves of the true lineage rate distributions and blue bars show the distributions of RRF rates. Rate unit is substitutions per site per million years. (g–i) Relationships between true times and RRF times in six rate scenarios. Black circles and lines represent the average times of 5 replicates simulated under rate scenarios in (a), (c), and (e), and gray triangles and lines represent the average times of 5 replicates simulated under rate scenarios in (b), (d), and (f). All times are normalized to the sum of ingroup divergence times. Regression slopes and correlation coefficients (r2) are shown.

