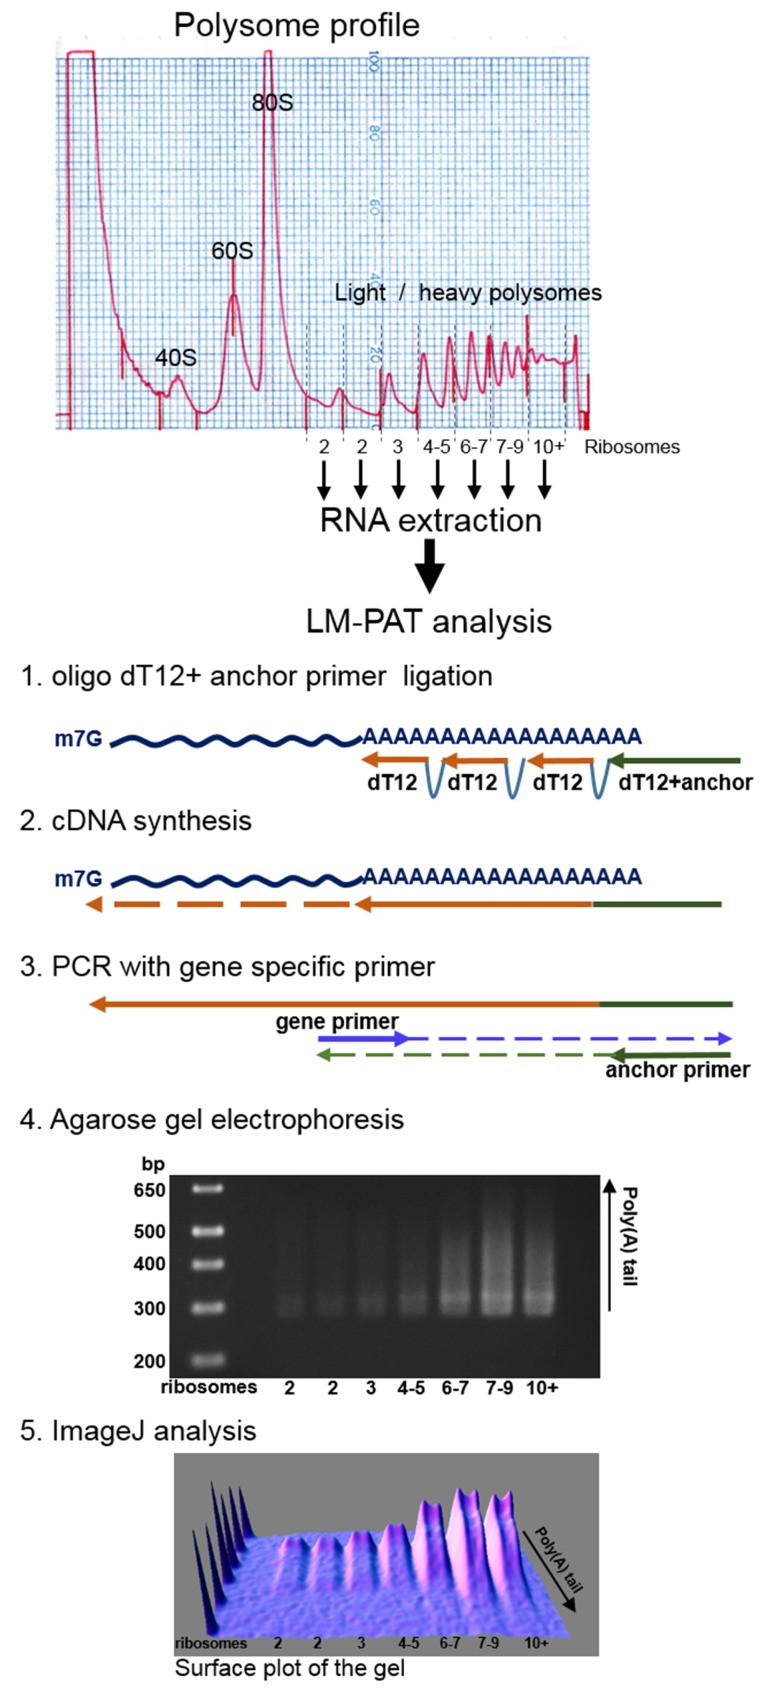
Figure 1. Schematic description of the experimental procedure.
Polysomes from human HCT116 cell extracts were separated by ultracentrifugation on a 15–50% sucrose gradient. RNA from polysomal fractions were isolated and subjected to Ligase-Mediated Poly(A) Test (LM-PAT). After amplification with gene specific forward primers of the resulting cDNA, the distribution of poly(A) tail lengths was visualized by agarose gel electrophoresis. The size of the DNA ladder fragments is indicated in base pairs on the left, the number of ribosomes in each fraction is indicated below the gel. 3D surface plot analysis of the agarose gel image was obtained using ImageJ software with minimum set to 0%, maximum to 100% and z-scale to 1.0.

