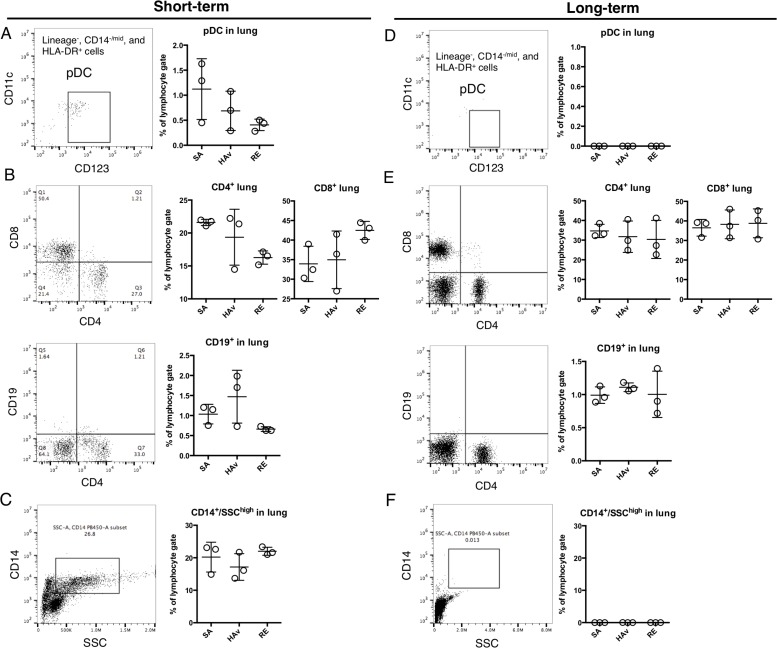
Figure 4. Retention of human immune cells in the blood and spleen of humanized mouse models.
Representative dot plots of pDCs (A and D) (lineage−, HLA-DR+, CD14−/mid, CD14−, and CD123+), (B and E) CD4+ T cells, CD8+ T cells, B cells (CD19+), and (C and F) monocytes (CD14+/SSChigh) in the ST-model (first letters) and LT-model (second letters). The humanized mice were vaccinated according to the scheme in Figure 1, and 16 h after the vaccination, lungs were collected and applied to the flow-cytometric analyses. Dot plots indicate the rate of lymphocyte gating in each cell subset. Each circle represents a result from an individual animal, and horizontal bars indicate mean ± SD.

