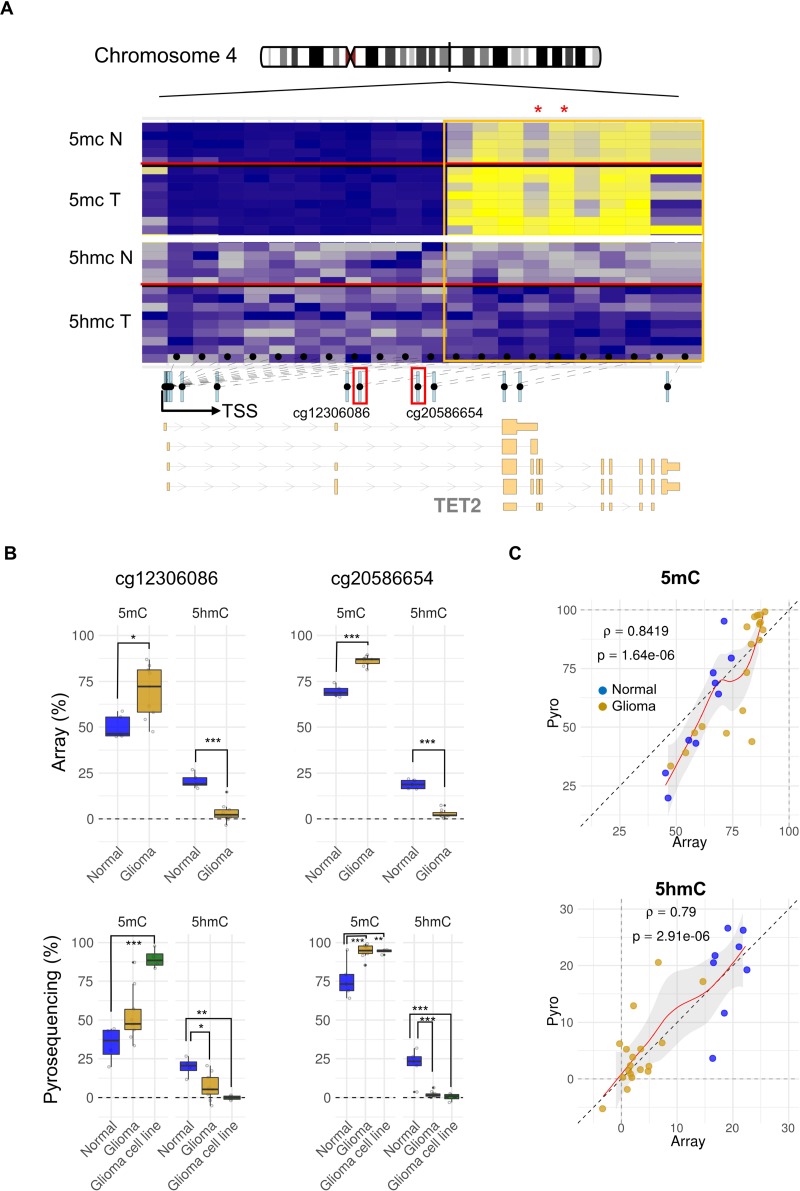
Figure 1. Locus specific TET2 alterations of DNA methylation and hydroxymethylation in glioma.
(A) Schematic representation of gene organization. Exons, introns, and transcription start site (TSS) locations are shown below. The 21 CpG positions along TET2 analyzed in the Illumina methylation array are indicated by black dots (intragenic CpG sites are bounded by the orange frame). Locus-specific patterns of DNA methylation (blue to yellow) and hydroxymethylation (gray to blue) in 5 non-tumorigenic human brain and 9 glioblastoma samples are shown. Location of representative CpGs selected for study (cg12306086 and cg20586654) are indicated by the small red boxes below the heatmap, in which they are marked with asterisks. (B) Box plot showing differences between the average percentage of 5 mC and 5 hmC in both normal brain and glioma samples of the two-representative intragenic CpGs studied (cg12306086 and cg20586654) (upper part). Technical validation by bisulfite pyrosequencing of 5 mC and 5 hmC changes occurring among normal samples (n = 5), primary tumors (n = 9) and glioblastoma cell lines (n = 4) are shown below. p-values were adjusted by applying the Bonferroni correction. *p-value < 0.05; **p-value < 0.01. (C) Scatter plots showing the percentage of 5 mC (upper panel) and 5 hmC (lower panel) in normal (blue plots) and tumoral (yellow plots) samples obtained by pyrosequencing (y-axis) and arrays (x-axis). ρ: Spearman rank correlation.

