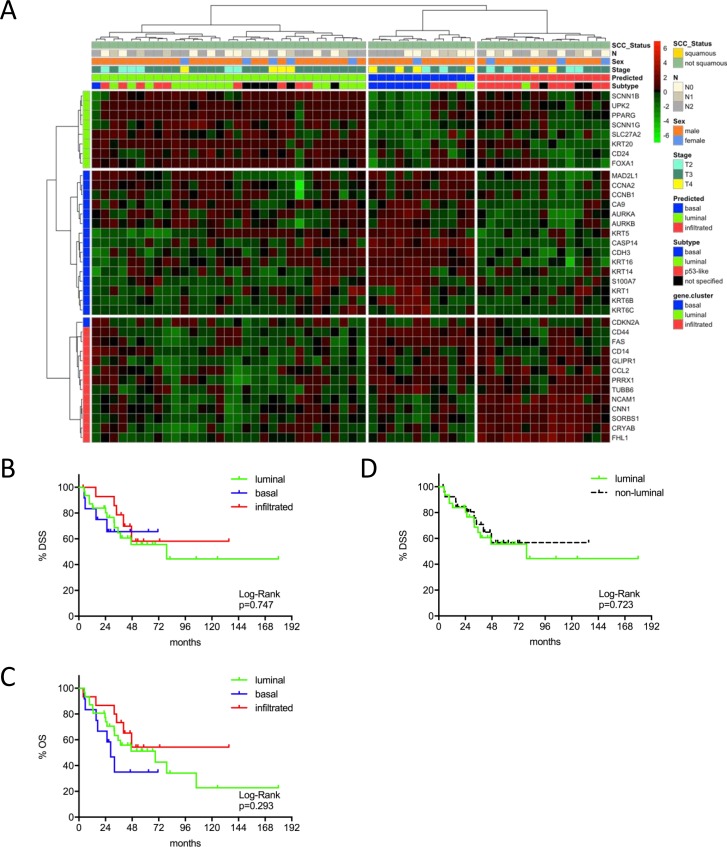
Figure 3.
(A) MIBC subtype classification of the MDA cohort (n=58) by gene expression profiling of the reduced consensus geneset based on in silico microarray data (GSE48276). (B, C) Kaplan-Meier plots of overall survival (OS) and disease specific survival (DSS) of the basal, luminal and infiltrated subtype. (D) Kaplan-Meier plots of DSS comparing survival of luminal versus non-luminal MIBC.

