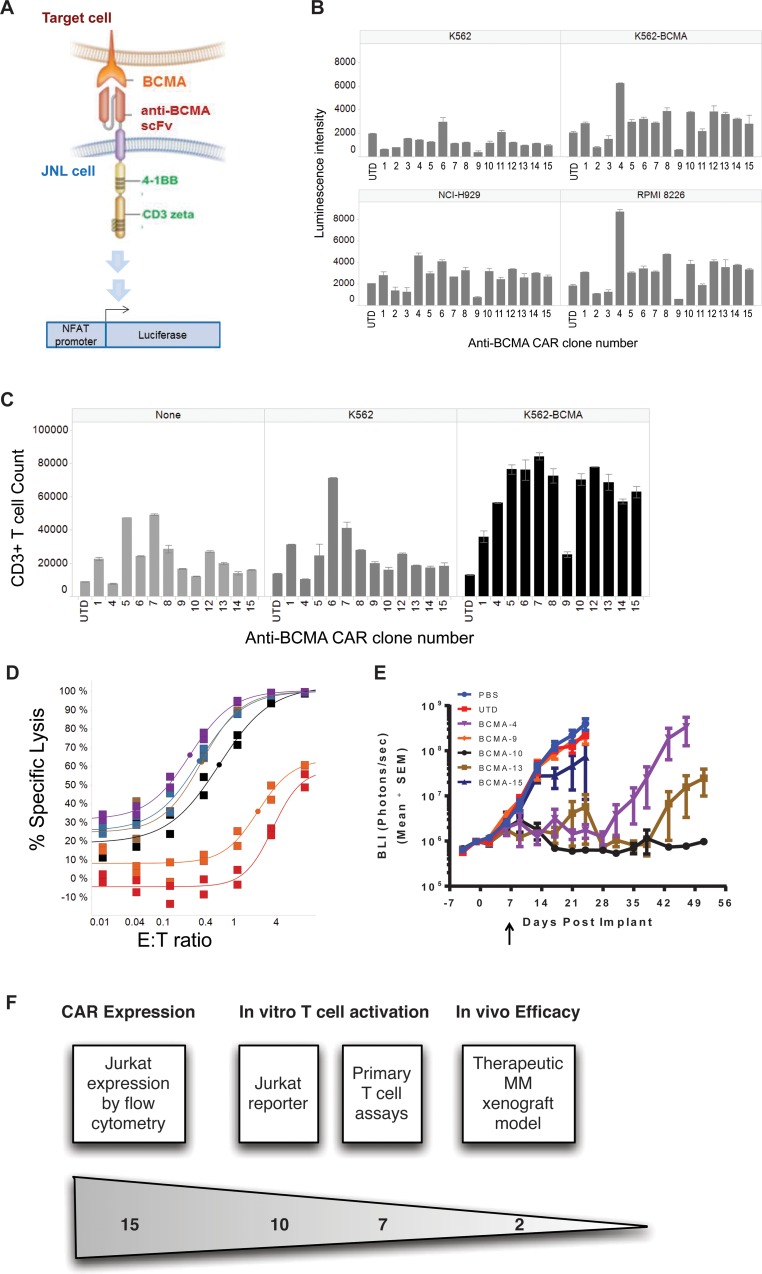
Figure 4. Identification of active and inactive clones using a reporter assay system.
(A) Schematic of the reporter assay. Jurkat cells containing the luciferase gene driven by the signaling-responsive NFAT promoter (termed JNL cells), were transduced with the various CAR constructs. Binding between the CAR construct and its cognate cellular antigen (BCMA on target cells) leads to luciferase expression in the JNL cells. (B) CAR clones were evaluated in the JNL reporter assay for antigen-dependent activity. JNL cells containing the indicated CAR clones with expression levels shown in C, or untransduced JNL cells (UTD) were co-cultured with target cells lines (K562, K562-BCMA, NCI-H929, or RPMI8226) and luciferase activity was measured as luminescence intensity. Clones were considered active when the luminescence intensity exceeded 1.25-fold the level of UTD cells in the presence of antigen-expressing cells. Clones were considered non-specific when the luminescence intensity exceeded 1.25 fold the level of UTD cells in the presence of antigen negative K562 cells. (C) T cells expressing the indicated CAR clones were evaluated for their ability to proliferate without antigen when co-cultured with no target cells (none), antigen negative irradiated cells (K562). Irradiated antigen-expressing cells (K562-BCMA) were used as a positive control. Proliferation was determined by counting CD3+ cells relative to CountBright Absolute Counting Beads. Untransduced T cells (UTD) revealed the basal level of CAR-independent effects of each target cell line on T-cell proliferation. (D) The ability of T cells expressing the indicated CAR clones to mediate cell lysis was evaluated against the KMS-11 target cell line expressing fire fly luciferase (KMS-11-luc). CART cells were co-cultured with KMS-11-luc target cells at the indicated E:T ratios, and % cell killing, determined by the difference in luciferase signal between target cells without effector T cells (control) and with effector T cells (experimental) expressed as a percent of the control, was measured as a surrogate for target cell lysis. UTD represents untransduced T cells. Individual data points represent the mean with the curve fit using an Emax model. (E) KMS11-luc cells were implanted in NSG mice and body luminescence (BLI) was monitored over time as a measure of tumor burden. CART cells (1.5 × 10⁶ CAR+ cells in 5 × 10⁶ total T cells), untransduced T cells (UTD; 5 × 10⁶ cells) or PBS were dosed intravenously on day 7 after implantation of 1 × 10⁶ tumor cells. 7 of mice were enrolled in each arm of the study. All data are expressed as mean ± standard error of the mean (SEM). This experiment is representative of 2 independent experiments.

