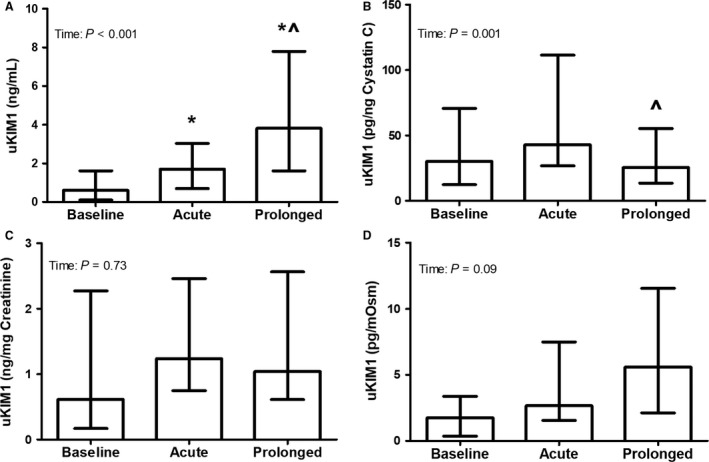
Figure 3.

Urinary KIM1 concentration uncorrected (A), as well as after correction for cystatin C (B), creatinine (C), and osmolality (D), at baseline and after acute and prolonged exercise (n = 22). A Friedman test was used to examine differences in uKIM1 over time, whereas a Wilcoxon signed‐rank test was used to assess differences acute and prolonged exercise. Data were presented as median (interquartile range). *Represents a significant difference from baseline, and ^represents a difference from acute exercise.
