
Figure 4.
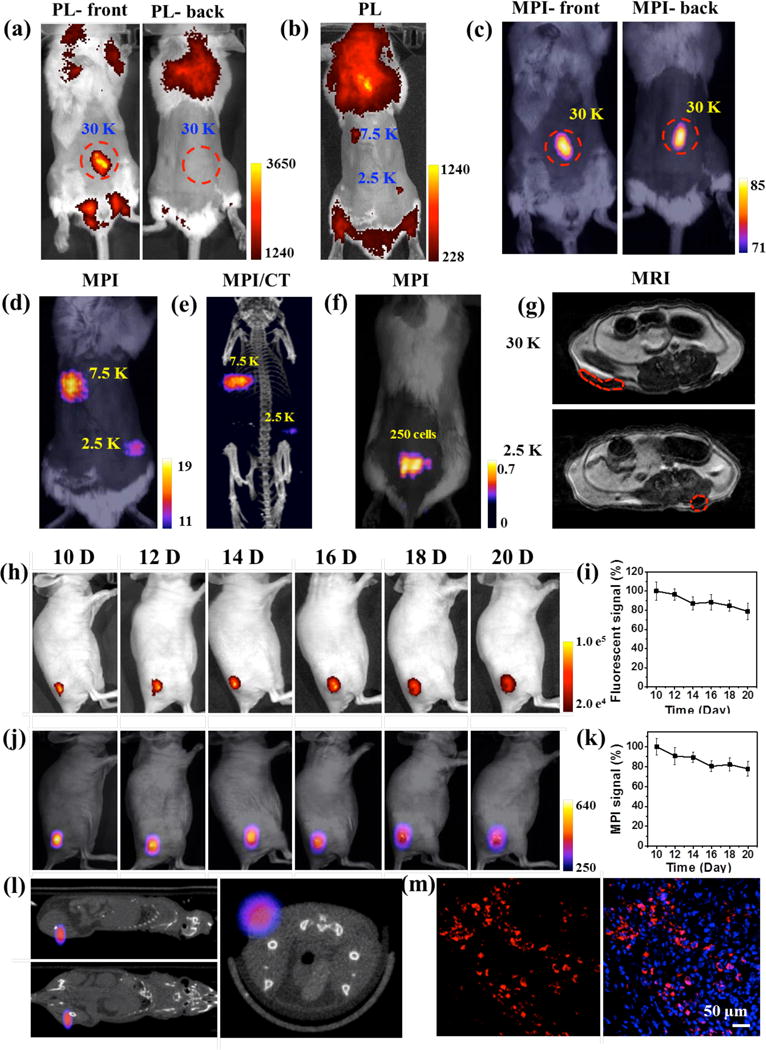
(a & b) Fluorescence imaging of a mouse from front or back view after local subcutaneous injection of Fe3O4@PFODBT-COOH labeled cells (excitation: 540 nm; emission: 680 nm). (c & d) Two-dimensional projection MP imaging of mouse from front view or back view, after local subcutaneous injection of labeled cells. (e) Three-dimensional MPI and CT imaging of mouse after local subcutaneous injection of labeled cells. (f) Overlay of white light picture and 2-D projection MPI image of a mouse implanted 250 labeled cells after background subtraction. (g) MRI transverse images of mouse body after local subcutaneous injection of cells labelled with Fe3O4@PFODBT-COOH. (h-m) In vivo tracking of HeLa cells xenograft tumor. The mice (n = 3) were subcutaneously implanted with Hela cells (3.5 × 10⁵) pre-labeled with Fe3O4@PFODBT-COOH. (h) Longitudinal fluorescence images of a representative mouse at different time points (excitation: 540 nm; emission: 680 nm). (i) Quantification of fluorescence signals (%) of tumor areas as a function of post implantation time, relative to the value of day 10 post implantation. (j) Longitudinal two-dimensional projection MPI images of a representative mouse over 10 days. (k) Quantification of MPI signals (%) of tumor areas as a function of post implantation time, relative to the value of the 10th day post implantation. (l) Three-dimensional whole-body MPI and CT imaging of a representative mouse at the 20th day post implantation. (m) Confocal images of tumor slice on the 20th day after implantation. The tumors were frozen, sliced, fixed and stained with DAPI; blue fluorescence: nuclei stained with DAPI, red fluorescence: Fe3O4@PFODBT-COOH.