
Extended Data Figure 9. Differential immune infiltration in various cancer types.
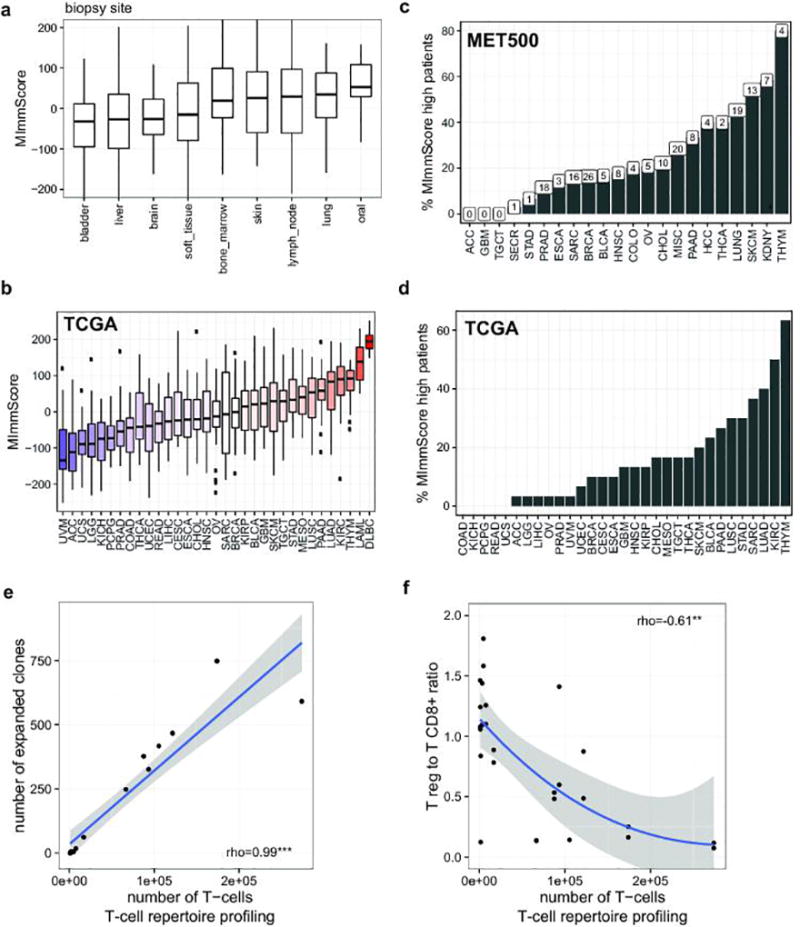
a. Distribution of MImmScores, a measure of the magnitude of immune infiltration in a tumor sample, for MET500 samples/patients grouped by tumor biopsy site. b. Distribution of MImmScores across the TCGA meta-cohort, grouped by primary cancer designation. Hematological malignancies (DLBC, LAML) are included as positive control. c. Percentage of patients in each of the MET500 analysis cohorts that has a high MImmScore defined here as >80th percentile across the whole MET500. The total number of cases with high MImmScore is indicated above each bar. d. Same as c but for the TCGA meta-cohort. e. Correlation between the total number of T-cells (templates) based on T-cell repertoire (DNA) sequencing of the T-cell receptor CDR3 sequence, and the number of expanded clones, an expanded T-cell clone is defined as having more than 30 cells with the same CDR3 sequence. f. Ratio of expression levels for markers of CD8+ T-cells (CD8A, CD8B) and T regs (FOXP3) as a function of the total number of T-cells. Significance levels of Spearman rank correlation coefficient: * (p=0.05–0.001), ** (p=0.001-1e-6), *** (p<1e-6).