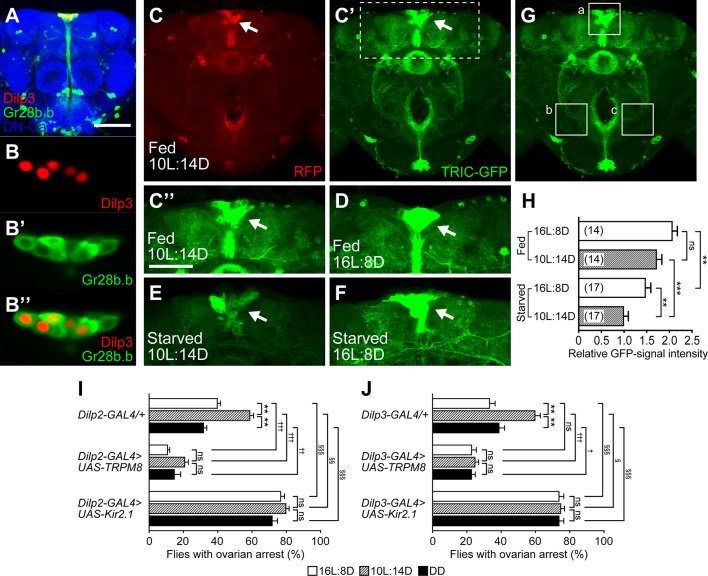
Fig 2. IPC activity levels are correlated with the incidence of reproductive dormancy.
(A) Expression of Gr28b.b-GAL4 in the brain (frontal view). (B-B”) Enlarged images of IPCs stained for Dilp3-lacZ (B and B”) and Gr28b.b-GAL4 (B’ and B”). 13 cells per brain were Dilp3-lacZ-positive and all of them expressed Gr28b.b-GAL4 as detected with UAS-mCD8::GFP. The brain was triply stained with an anti-GFP antibody for Gr28b.b-GAL4 (green), an anti-β-galactosidase antibody for the product of Dilp3-lacZ (red), and an anti-DN-cadherin (blue) for visualizing the brain structure. (C to H) The TRIC assay revealed that starved flies kept under a 10L:14D photoperiod exhibited a lower transcriptional reporter level than those kept under a 16L:8D photoperiod. Typical examples of IPCs (arrows) with expression of RFP (C) and GFP (C’ to F) in the TRIC assay. Labeling of target neurons (IPCs) with RFP was independent of the neural activity levels, whereas GFP expression reflected the level of neural activity because it was proportional to the amount of reconstituted split GAL4, which was correlated with the activity-dependent Ca2+ influx. All flies were exposed to a cold challenge (11°C) under the conditions of 10L:14D/ad lib feeding (C to C”), 16L:8D/ad lib feeding (D), 10L:14D/starvation (E) and 16L:8D/starvation (F) for 7 days. The boxed region in (C’) is enlarged in (C”). The labeling intensity of GFP was weaker in the starved flies kept under the 10L:14D photoperiod (E) than in the flies kept under the 16L:8D photoperiod (F). Scale bars: 100 μm (A); 50 μm (C”). (G) The brain region examined for quantification of the TRIC-signal intensity (ITRIC). The GFP-labeling intensity was measured at the three brain areas indicated by dotted squares, areas a, b and c, and the signal intensity was calculated with the equation ITRIC = a–(b + c) / 2, where a, b and c are the signal intensity at areas a, b and c, respectively. (H) Comparisons of ITRIC between the flies kept under the conditions of 10L:14D/ad lib feeding, 16L:8D/ad lib feeding, 10L:14D/starvation and 16L:8D/starvation. The temperature was 11°C in all cases. The means ± SEM are shown. ns, no significance, **P < 0.01, ***P < 0.001, by the one-way ANOVA post hoc Tukey’s multiple comparisons test (see S1 Table for numerical data). The genotypes of flies used were 10 × UAS-IVS-mCD8::RFP, LexAop2-mCD8::GFP / w; UAS-MKII::nlsLexADBDo, UAS-p65AD::CaM / Gr28b.b-GAL4; UAS-p65AD::CaM / +. (I and J) The proportion of flies with ovarian arrest was decreased by activation (middle data set) and increased by inactivation (lower data set) of IPCs in comparison with the control (upper data set). Flies expressed GAL4 ((I) Dilp2-GAL4; (J) Dilp3-GAL4) alone (upper data set) or GAL4 together with UAS-TRPM8 (middle data set) or UAS-Kir2.1 (lower data set). The means ± SEM are shown. Statistical comparisons were made between the two photoperiodic conditions within the same genotype (*), between the GAL4-only control and TRPM8-test genotypes (†) or between the GAL-only and Kir2.1-test genotypes (§). ns, no significance, */†/§P<0.05; **/††/§§P<0.01; ***/†††/§§§P<0.001, by the two-tailed Fisher’s exact test (see S1 Table for numerical data).

