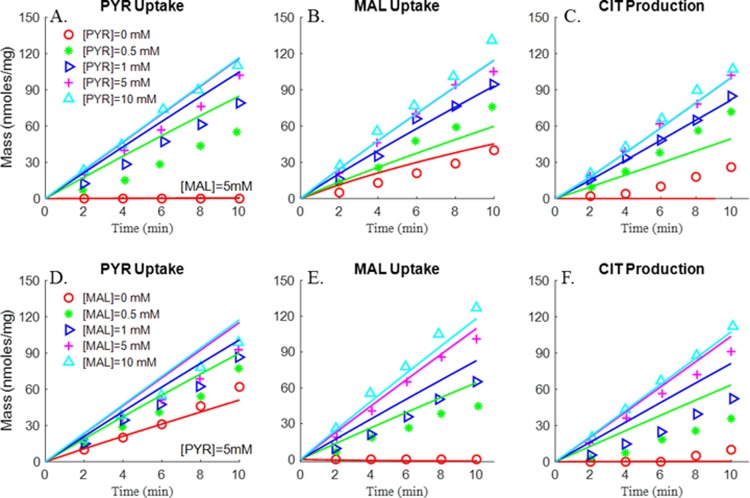
Fig 2. Substrate-dependent responses of pyruvate (PYR) uptake, malate (MAL) uptake and citrate (CIT) production (Evans et al. [27]).
Rat lung mitochondria were incubated at 30°C in 1.0 ml buffer containing 4 mM Pi, and 0.7 mg mitochondria protein, buffer pH = 7.4. Mitochondria were incubated in the presence of different substrate concentrations. Fig 2A, 2B and 2C: (A) mitochondria were incubated with 5 mM MAL ([MAL] = 5 mM) and different concentrations of PYR: [PYR] = 0 mM (red circle), [PYR] = 0.5 mM (green star), [PYR] = 1 mM (blue triangle), [PYR] = 5 mM (purple plus sign), [PYR] = 10 mM (cyan triangle). Figs 2D, 2E and 1F: mitochondria were incubated with fixed PYR concentration ([PYR] = 5 mM) and different concentrations of MAL: [MAL] = 0 mM (red circle), [MAL] = 0.5 mM (green star), [MAL] = 1 mM (blue triangle), [MAL] = 5 mM (purple plus sign), [MAL] = 10 mM (cyan triangle). PYR uptake rate (A, D), MAL uptake rate (B, E) and CIT production rate (C, F) were measured over a 10-minute incubation period. Symbols are experimental data and lines are integrated model fits.

