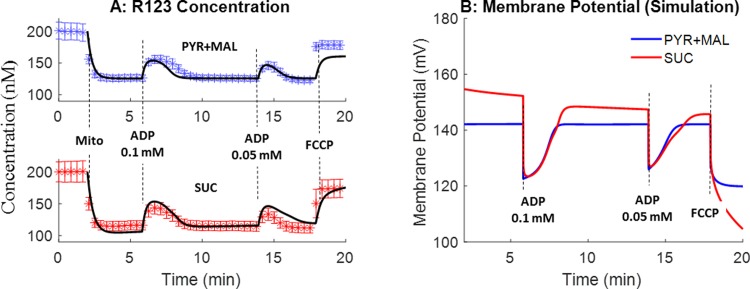
Fig 8. Model validation using membrane potential data.
Experiments were performed under the same experimental condition as in Fig 4. R123 buffer concentrations are shown (symbols). Either pyruvate + malate (PYR+MAL, blue, n = 4) or succinate (SUC, red, n = 4) was used as the metabolic substrate. Values are mean ± SE. Black lines in Fig 8A are model predictions using the estimated values of the model parameters in Table 2. Fig 8B shows integrated model predictions of the mitochondrial membrane potential with either PYR + MAL or SUC as the metabolic substrates and with the values of the model parameters set to those in Table 2.

