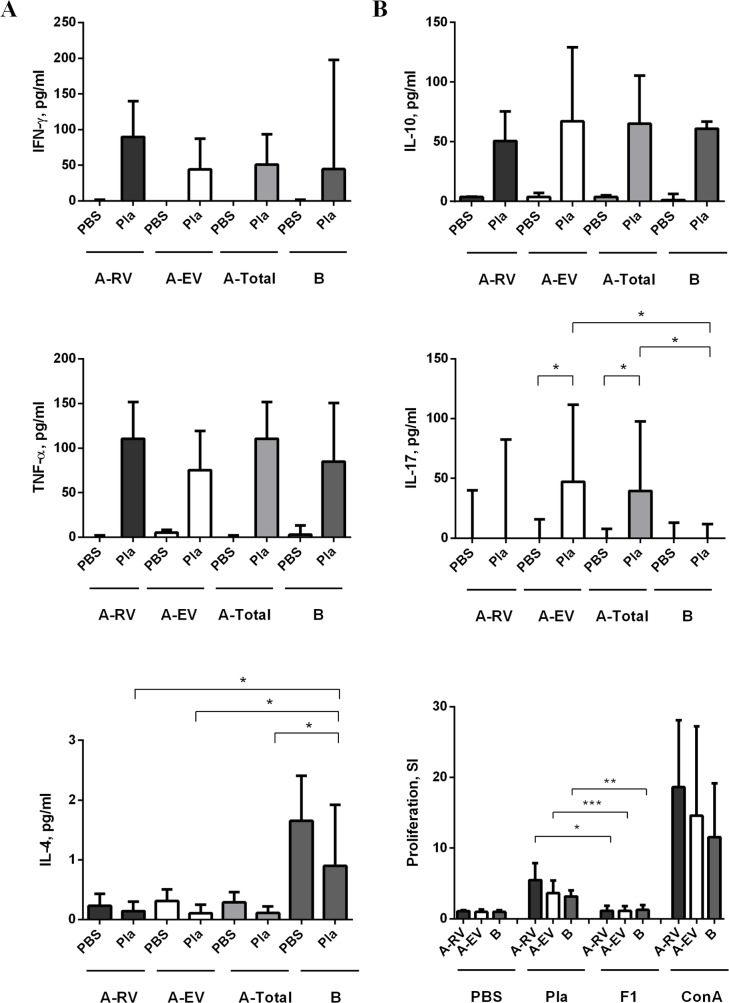
Fig 1. Measurement of cytokines in supernatants of human PBMCs of immunized (group A) and naïve (group B) donors stimulated with recombinant Pla [5 μg/ml] or F1 [2 μg/ml].
Group A was further divided into subgroups A-RV (recently vaccinated, n = 13) and A-EV (earlier vaccinated, n = 21) with post vaccination time less and more than one year, respectively. The SI was calculated against unstimulated cells (PBS). Concanavalin A (Con A) [1 mg/ml] served as positive control stimulus. The concentration of cytokines IL-10, and IL-17A (panel A) and IFN-γ, TNF-α, and IL-4 (panel B) is given in picograms per milliliter (pg/ml). The bars represent the median ± interquartile range calculated from quadruplicates. The statistical analysis was done by Mann-Whitney test. Statistically significant differences between the groups are indicated by * (p<0.05), ** (p<0.01), and *** (p<0.0001).

