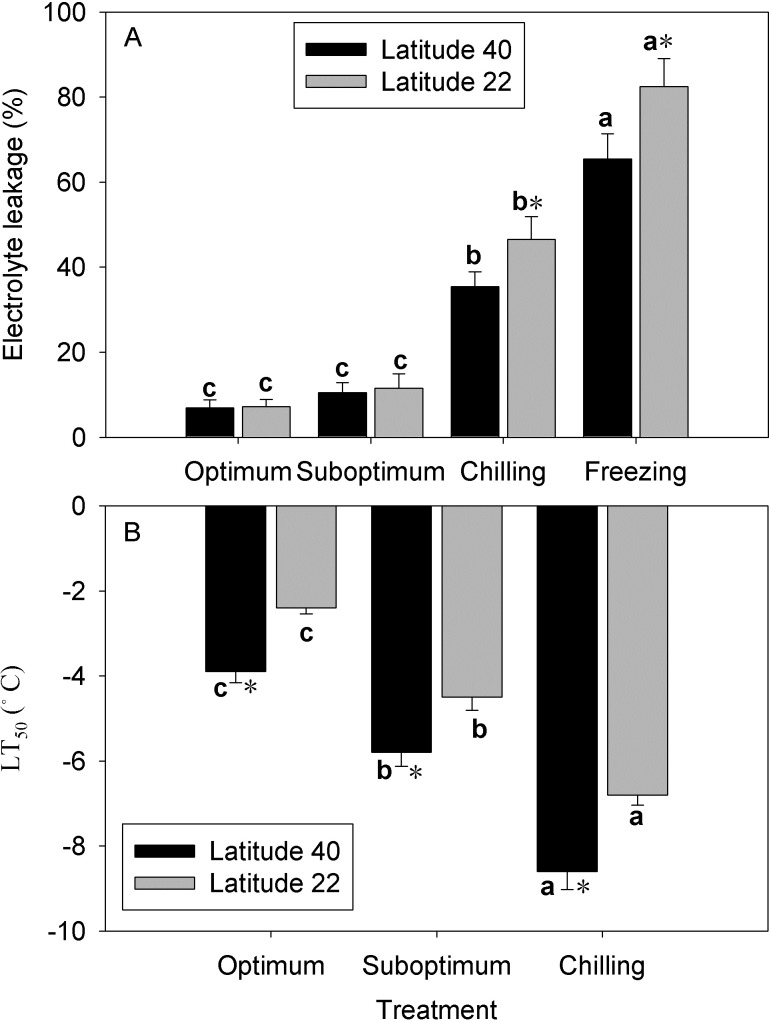
Fig 2. Effect of low temperature on the leaf electrolyte leakage (EL, A) and lethal temperature for 50% loss of electrolytes (LT50, B) in two zoysiagrass genotypes native to diverse latitude.
Vertical bars on the top indicate standard deviation, and bars with the same letter indicate no significant difference at P < 0.05 for the comparison of differential temperature treatment at a given genotype, and * on the top indicate significant difference at P < 0.05 between two genotypes at a given temperature treatment.

