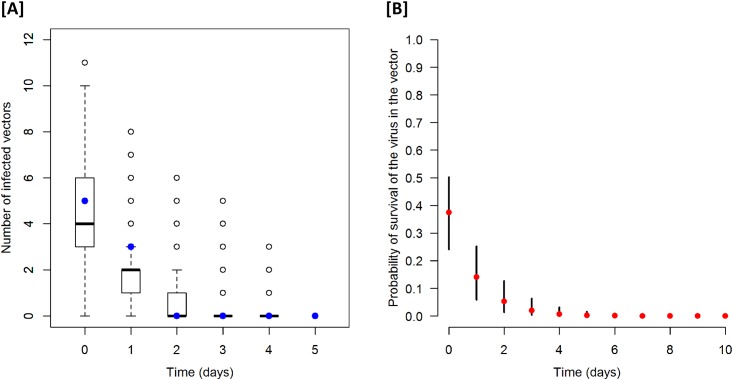
Fig 2. Reported and posterior predicted numbers of infected vectors [A] and Posterior probability of LSDV surviving in Stomoxys calcitrans [B].
[A] The blue dots refer to the experimental results reported by [13], and the boxplots refer to the distribution of model predictions using the estimated posterior distribution; [B] Time refers to the number of days after an infective blood meal. The solid black lines and the red dots show the 95% credible interval and the median of the posterior distribution.

