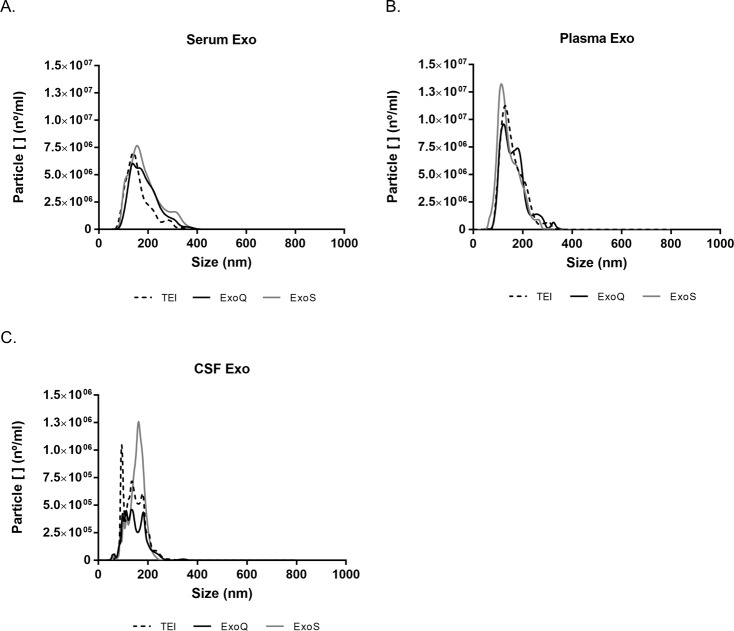
Fig 2. Size profiles of exosomes isolated from distinct biofluids using different methods.
Size distribution curves were determined by NTA. (A) Serum, (B) Plasma and (C) CSF. Each curve represents the average of the 3 technical replicate measurements for each exosome isolation method and biofluid triplicate experiment.

