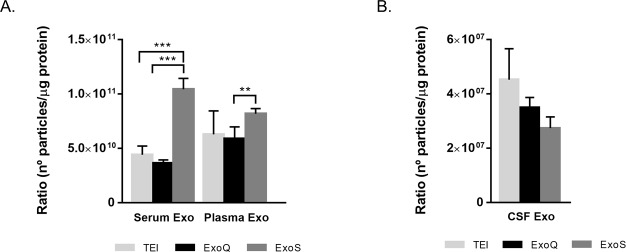
Fig 6. Purity ratio of exosome preparations.
Normalization of exosome concentrations determined by NTA per protein concentration measured by BCA for serum- and plasma-derived exosomes isolated and by Micro BCA for CSF-derived exosomes. Each bar represents mean ratio and error bars indicates standard deviations (n = 3±SD). **p≤0.01, ***p≤0.001.

