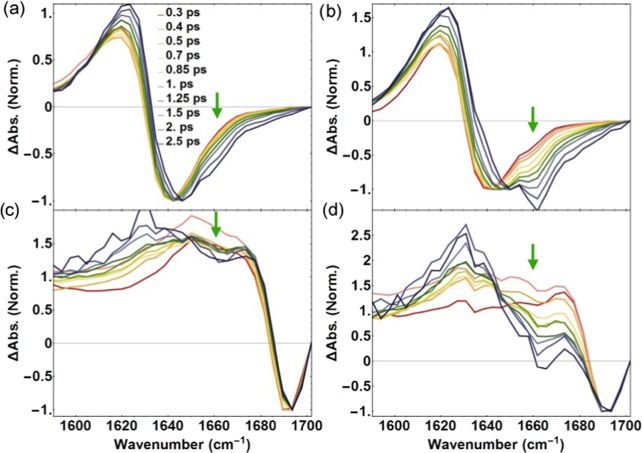
Figure 3.
Slices taken through the 2D IR spectra of fibrinogen for ωpump = 1627 cm–1 (a, b) and ωpump = 1680 cm–1 (c, d). The ⟨ZZZZ⟩ (a,c) and ⟨ZZYY⟩ (b,d) 2D IR spectra at different time delays clearly represent the ingrowth around ωprobe = 1660 cm–1 as pointed out by the green arrows. Every slice is normalized with the corresponding bleach signal to illustrate the ingrowth. The time delays are displayed in the legends and the absorption change measured in 2D IR is denoted by ΔAbs.

