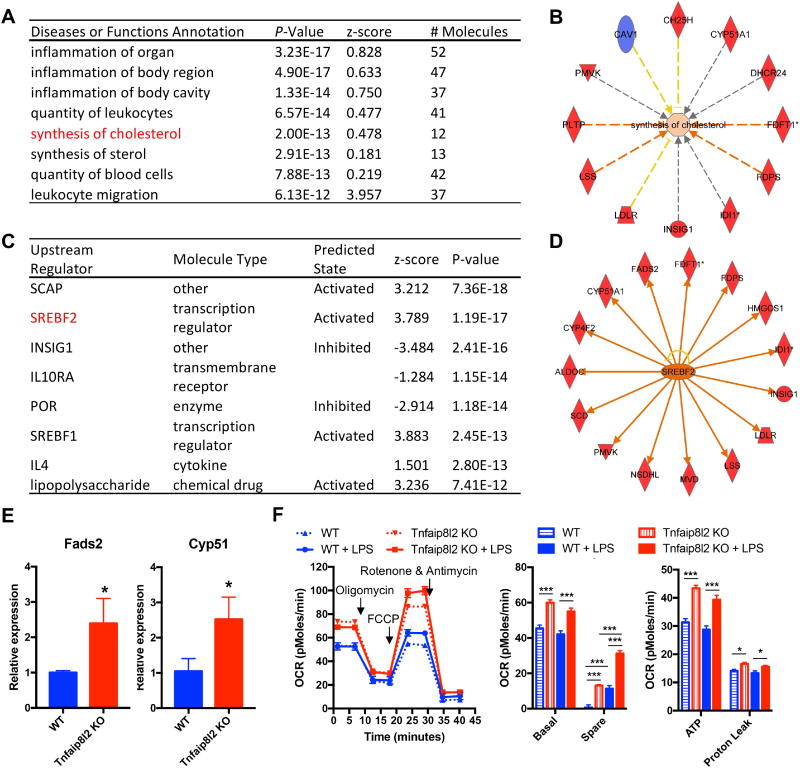
Figure 5. TNFAIP8L2 negatively regulates genes related to transcription factor Sterol regulatory element-binding protein 2 (SREBP-2) and mitochondrial respiration.
Bone marrow-derived macrophages from either wild type mice or Tnfaip8l2 gene knockout (KO) mice were challenged with LPS (100 ng/mL) for 1 hour and microarray with Ingenuity Pathway Analysis (A to D), qPCR (E), and mitochondrial respiration measurement by Seahorse XF96 analyzer (F) were performed. A. Top enriched diseases or functions annotation of the genes that are changed by more than 1.5-folds in Tnfaip8l2 gene KO mice. B. Tnfaip8l2 KO macrophages are positively enriched with the “synthesis of cholesterol” gene signature. C. Top upstream regulator analysis of the genes that are changed by more than 1.5-folds in Tnfaip8l2 gene KO mice. D. The 15 SREBP2-dependent genes that are induced by more than 1.5-folds in Tnfaip8l2 gene KO mice. Blue color indicates decreased gene expression, while red color indicates increased gene expression in Tnfaip8l2 KO macrophages. E. Confirmation of Fads2 and Cyp51 gene expression by qPCR (n=3 in each group). F. BMDMs from WT or Tnfaip8l2 KO mice were treated with vehicle control or LPS (100ng/mL) for 1 hour and oxygen consumption rate (OCR) was measured using Seahorse XF96 analyzer. Afterwards, XF Mito Stress Test was performed by sequential adding of Oligomycin (2 μM), FCCP (2 μM), and Rotenone (1 μM). Experiment plot (left) and quantification of four mitochondrial parameters (right) were shown (n=7 to 8 in each group). For all panels, data are expressed as mean ± SEM.*, p<0.05, **, p<0.01, ***, p<0.001, NS, not significant.

