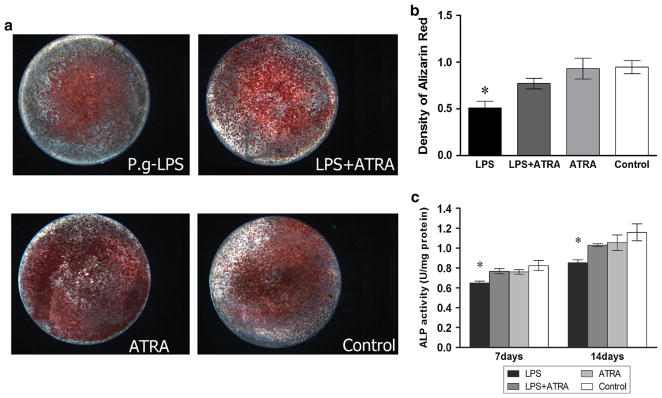
Fig. 3.
a Representative Alizarin Red staining showing the osteoblastic differentiation of BMSCs cultured on titanium surface for 2 weeks after stimulation (×10). b OD values of the destained solution of Alizarin Red from above cells staining. c Quantitative results of ALP assay of BMSCs in osteogenic medium. Data were expressed as mean ± SD from three independent cultures with triplicates, *P < 0.05 indicated the difference compared to control group

