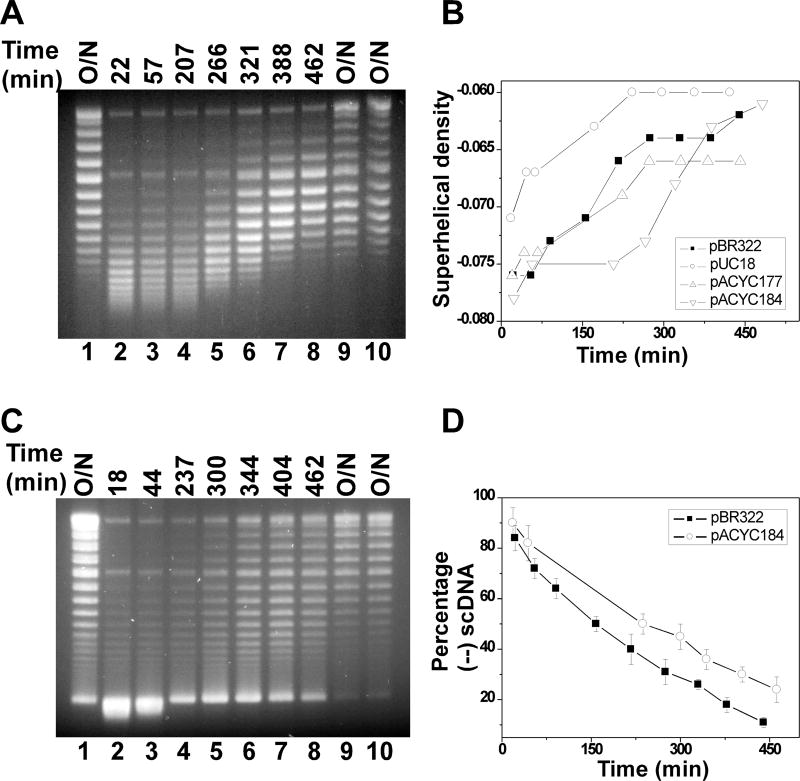
Figure 1.
Time courses of DNA supercoiling status in MG1655 (A, B) and VS111 (C, D). Overnight cultures of E.coli cells carrying plasmids pBR322, pUC18, pACYC177, or pACYC184 were diluted 100-fold in LB and grown to the time points indicated. The DNA molecules were isolated using the alkaline lysis assays using the QIAprep Spin Miniprep Kit. The DNA samples were subjected to 1% agarose gel electrophoresis in the presence of 5 µg/mL of chloroquine. The DNA supercoiling densities were determined as detailed in Method 3.3 and 3.4. The symbol of (-) represents the hypernegatively supercoiled DNA.

