Fig. 3.
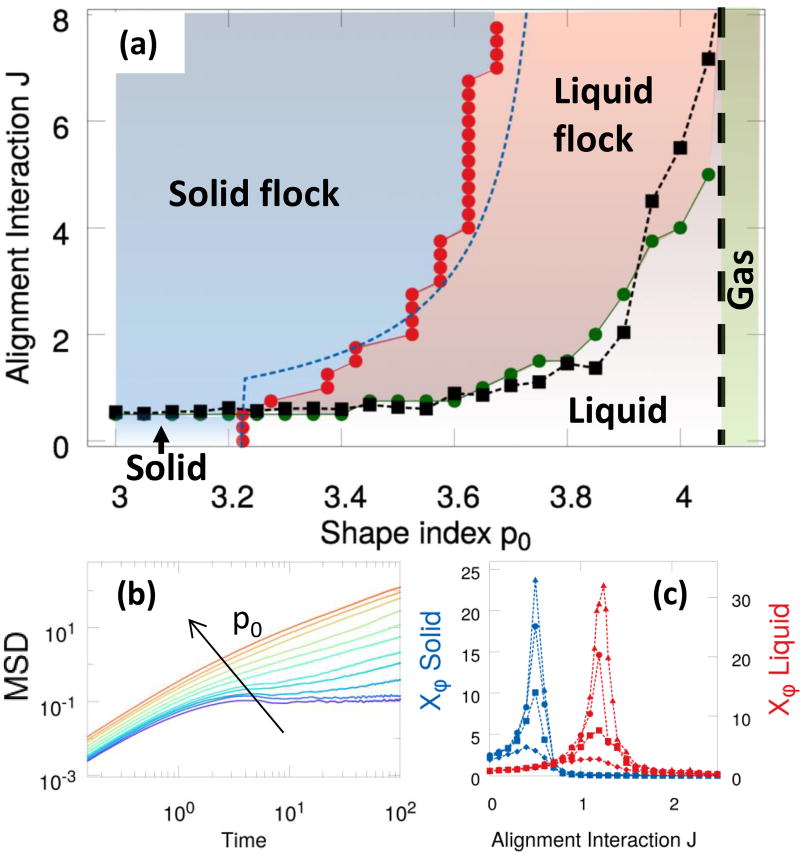
Phase diagram. (a) Different phases in the (p0,J) plane. The solid/liquid transition line (red circles) is obtained from the vanishing of Deff and the flocking transition line (green circles) corresponds to the peak in the susceptibility χφ. The dashed blue curve is the theoretical prediction Jc(v0,p0) given in (4). The black squares (the dashed line is a guide to the eye) are the estimate for Jflock(p0) in terms of the numerically calculated cage lifetime τcage at J = 0. The vertical dashed black line marks the transition to a gas-like state, observed for p0 ≳ 4.2, where flocking cannot occur. (b) The mean square displacement for J = 2.0 for a range of p0 ∈ [3.4,4] across the liquid/solid transition (curves from red to violet). (c) The susceptibility χφ for p0 = 3.1 (blue symbols, solid) and p0 = 3.7 (red symbols, liquid) and sizes N = 100, 400, 1600, 3200, diamonds, squares, circles, and triangles, respectively.

