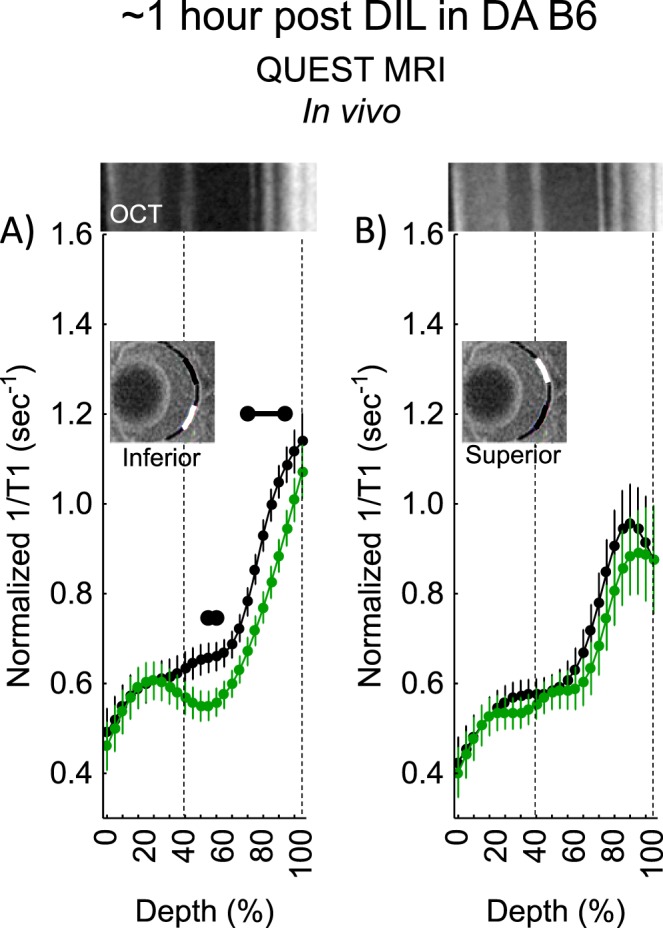
Figure 3.

QUEST MRI measurements approximately 1-hour post d-cis-diltiazem in dark-adapted (DA) B6 mice. Modeling results of normalized 1/T1 MRI profiles in vivo for (A) inferior and (B) superior retina after administration of either saline (black, n = 7) or MB+ALA (green, n = 7) in different subgroups of mice. Other graphing conventions are described in the legend for Figure 2. Representative images from inferior and superior retina from OCT images of approximately 4-hours post DA B6 mice are shown above the approximately 1-hour post profiles. The use of OCT images from a different time point is not expected to introduce substantial alignment error because no differences were found in retinal thickness as measured on MRI between any of the post d-cis-diltiazem groups. Each 1/T1 data set was normalized to its TR 150 ms image (“normalized 1/T1”), as detailed in the Materials and Methods section.
