Figure 7.
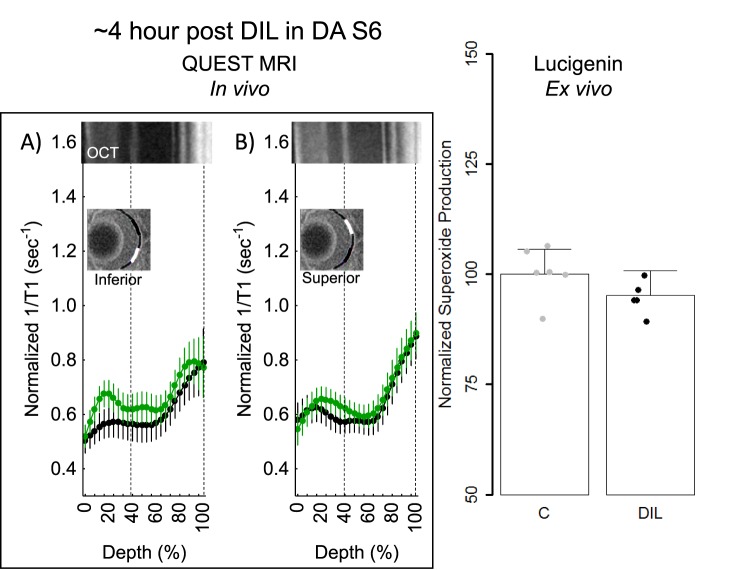
QUEST MRI and superoxide measurements approximately 4-hours post d-cis-diltiazem in DA S6 mice. Modeling results of normalized 1/T1 MRI profiles in vivo for (A) inferior and (B) superior retina after administration of either saline (black, n = 5) or MB+ALA (green, n = 6) in different subgroups of mice. Other graphing conventions are described in the legend for Figures 2 and 3. Representative images from inferior and superior retina from OCT images of approximately 4-hours post DA B6 mice are shown above the S6 hour post profiles. The use of OCT images from a different time point is not expected to introduce substantial alignment error because no differences were found in retinal thickness as measured on MRI between any of the groups, also, no differences in retinal layer spacing was previously reported on OCT images of B6 and S6 mice.41 (C) Modeled superoxide production normalized to same day controls from excised whole retinas from S6 (n = 6) and 4-hours post d-cis-diltiazem in S6 mice (n = 5). Individual data points (= number of eyes examined; one eye per mouse) represent the replicate average for each mouse to illustrate animal-to-animal variation; error bars: 95% confidence intervals. Black bar = significant difference (P < 0.05).

