Figure 1.
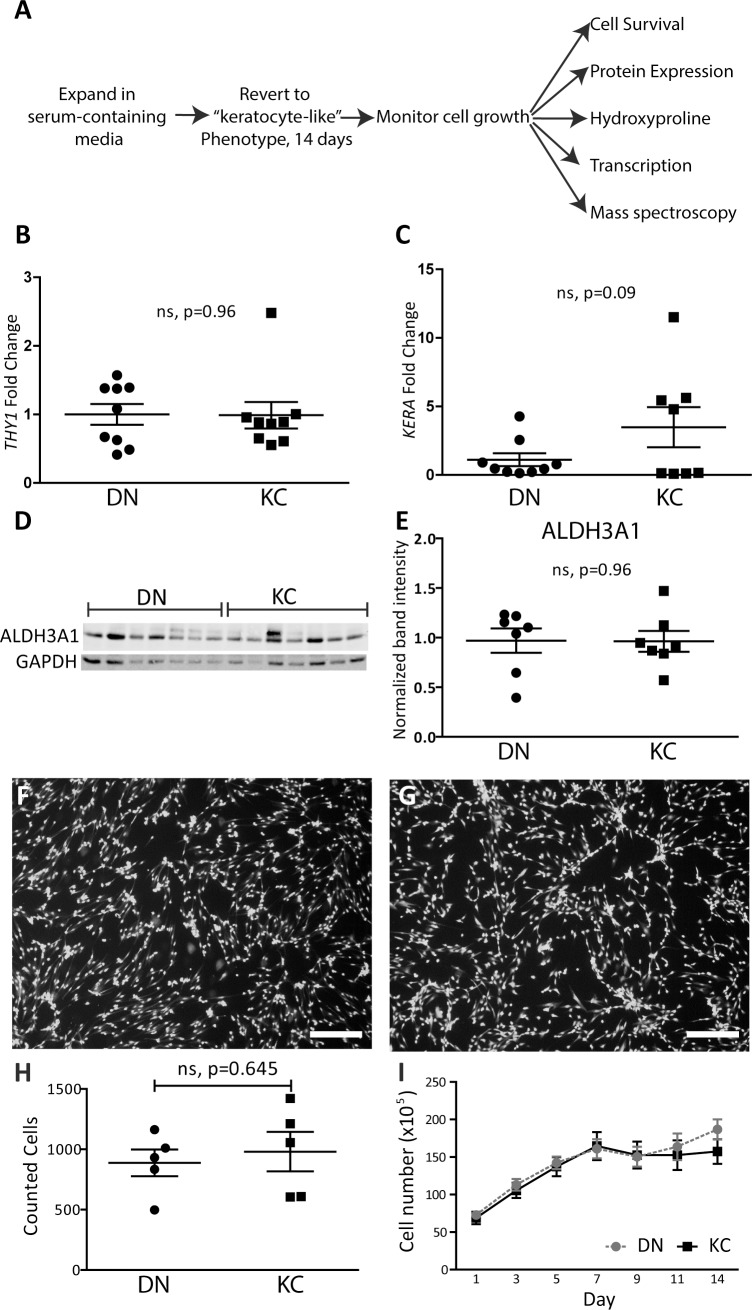
KC cells have comparable survival in LGSF medium. (A) Timeline for inducing the keratocyte phenotype and assessing collagen matrix and cellular phenotypes during 14 days of culture in LGSF. (B) Quantitative PCR fibroblast marker THY1 and (C) of quiescence keratocyte marker KERA; points indicate mean individual expression levels as calculated using 2−ΔΔcT relative to POLR2A, n ≥ 9 biological repeats. (D, E) ALDH3A1 levels in 7 DN and KC keratocyte culture extracts after 14 days; points represent quantification of band intensity normalized to GAPDH. Representative 10X image of live cells (calcein AM) at day 14 in (F) DN and (G) KC cultures, n = 5, scale bar: 200 μm. (H) Quantification of live cells in field of view at day 14, points indicate total live cells in random images from each individual DN or KC culture. (I) Total cell number over duration of cultures calculated from resazurin reduction assay. Values are shown as mean ± SD; statistical significances were calculated using the Student's t-test.

