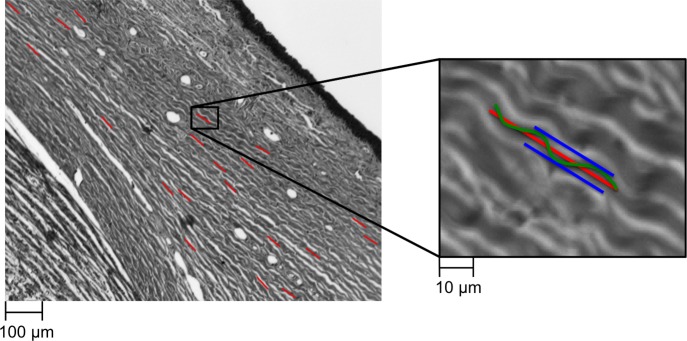
Figure 3.
Line markings were used to quantify collagen fiber crimp tortuosity, waviness, and amplitude. A few example line markings used for measuring these crimp parameters are shown on the left panel (red lines) overlaid on a brightfield image. To the right is a close up of a marked collagen bundle. Tortuosity was computed as the ratio of fiber path length (green wavy line) over the end-to-end length (red line); waviness was computed as the circular SD of the fiber orientation along the end-to-end path; amplitude was defined as half the distance from peak to trough within a wave (blue lines).

