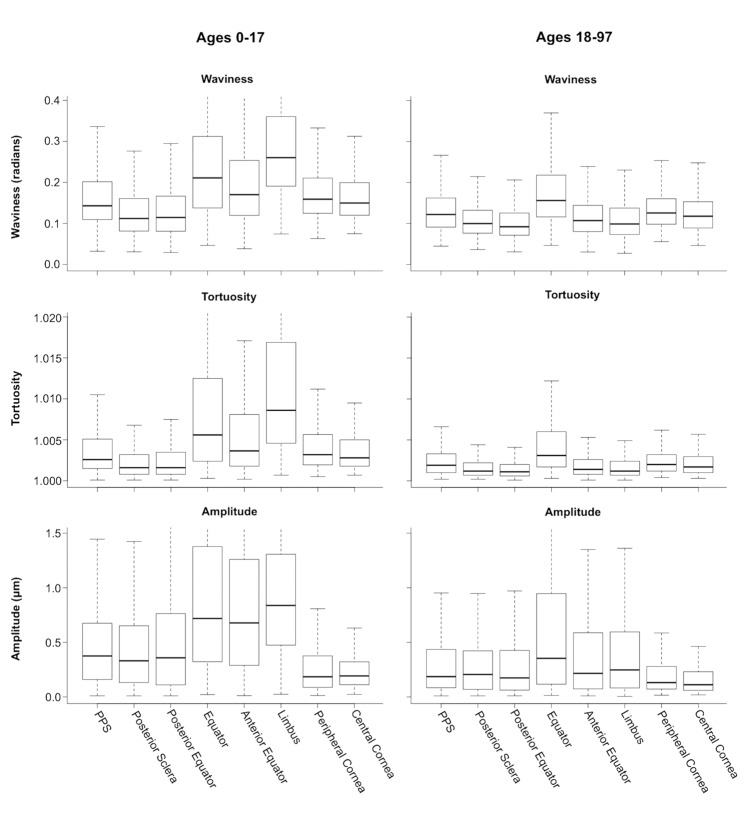
Figure 7.
Boxplots of waviness, tortuosity, and amplitude from the posterior to the anterior of the globe. The plots on the left are the trends across the globe in youth (ages 0–17) and the plots on the right are the trends in adults (18–97). There are similar decreases in both medians and range for all of the regions except the limbus.

