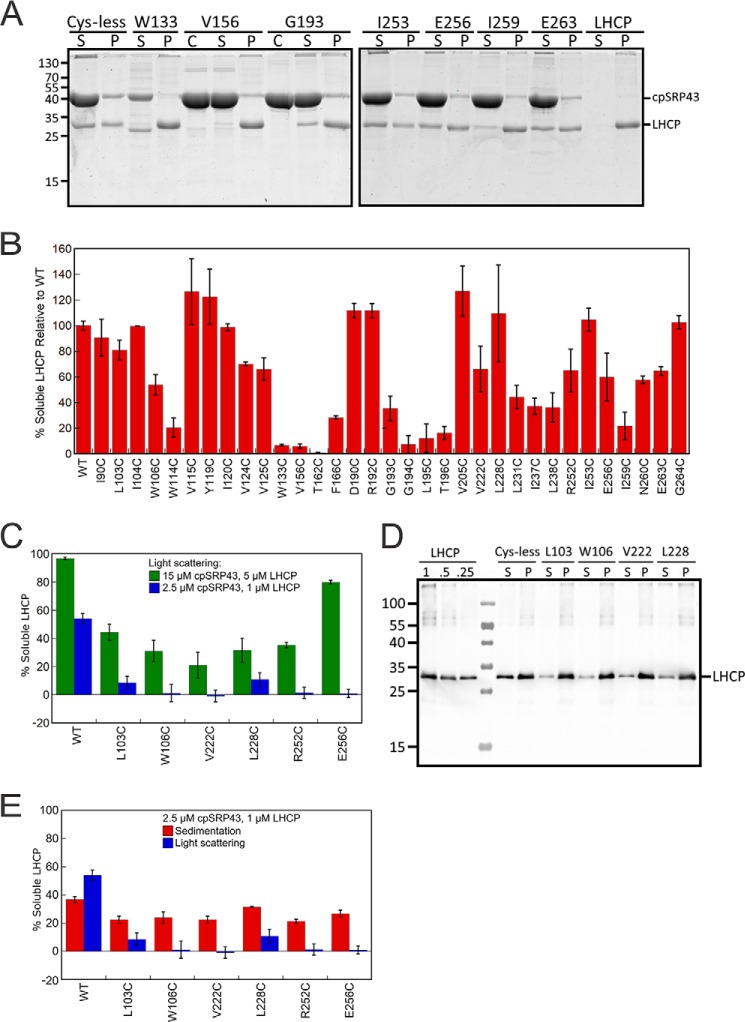
Figure 5.
Analysis of the chaperone activity of mutant cpSRP43 using the sedimentation assay and comparison with the results of light scattering assay. A, representative Coomassie-stained gels for analysis of the chaperone activity of cpSRP43 mutants using the sedimentation assay. C denotes lanes with cpSRP43 only; S denotes the soluble fraction; P denotes pellet. B, summary of the relative chaperone activity of all cpSRP43 mutants measured by the sedimentation assay. Values are reported relative to Cys-less cpSRP43 (WT). C, comparison of the chaperone activity of cpSRP43 mutants measured at high (green) and low (blue) protein concentrations using the light scattering assay. D, representative Western blot images for analysis of the chaperone activity of cpSRP43 mutants using the sedimentation assay at low protein concentrations. C denotes lanes with cpSRP43 only; S denotes the soluble fraction; P denotes pellet. LHCP denotes controls where indicated concentrations of purified LHCP were loaded to assess the dynamic range of Western blotting. E, comparison of the chaperone activity of cpSRP43 variants measured by the sedimentation (red; data from D and replicates) and light scattering (blue) assays at the same concentration. Data were reported as mean ± S.E., with n = 2–9.

