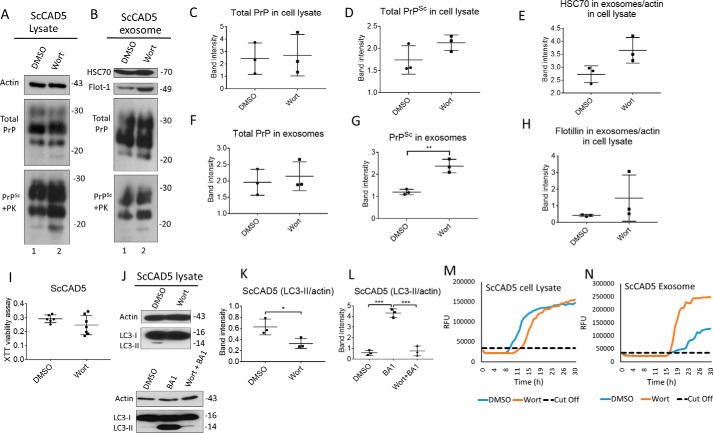
Figure 5.
Inhibition of autophagy increases exosome release and exosomal PrPSc in ScCAD5 cells. A and B, Western blotting of cell lysate and exosomes from ScCAD5 cells, respectively, treated with 4 nm of wortmannin (Wort) for 48 h or solvent only treated (DMSO). HSC70 and flotillin-1 (Flot-1) were used as exosome markers. Actin was used as loading control for cell lysate. PrP (−/+ PK) was probed with mAb 4H11. C and D, densitometric analysis for either total PrP or PrPSc, respectively, from ScCAD5 cell lysate normalized with actin (± S.D.) after treatment with 4 nm of wortmannin or DMSO (n = 3 experiments). E and H, densitometric analysis for exosomal HSC70 and flotillin-1, respectively, normalized with actin in the corresponding cell lysate (± S.D.; n = 3 experiments). F and G, densitometric analysis for either total PrP or PrPSc, respectively, from ScCAD5 exosomes normalized with actin in the corresponding cell lysate (± S.D.; n = 3 experiments). **, p < 0.01. I, XTT viability assay. ScCAD5 cells were treated with 4 nm wortmannin or DMSO for 48 h; then cell viability was detected based on metabolic activity (± S.D.; n = 7 replicates). J, upper panel, Western blotting of cell lysate of ScCAD5 cells treated with vehicle only (DMSO) or 4 nm of wortmannin for 4 h. Lower panel, Western blotting of cell lysate of ScCAD5 cells treated with vehicle only (DMSO), 4 nm of wortmannin, or wortmannin with bafilomycin A1 (Wort + BA1) for 4 h. LC3 was used to measure the autophagic flux and actin was used as loading control. K and L, densitometric analysis for LC3-II protein levels normalized with actin (± S.D.; n = 3 replicates). *, p < 0.05; ***, p < 0.001. M and N, RT-QuIC for either ScCAD5 cell lysate or exosomes, respectively. The cells were treated with wortmannin or solvent only (DMSO).

