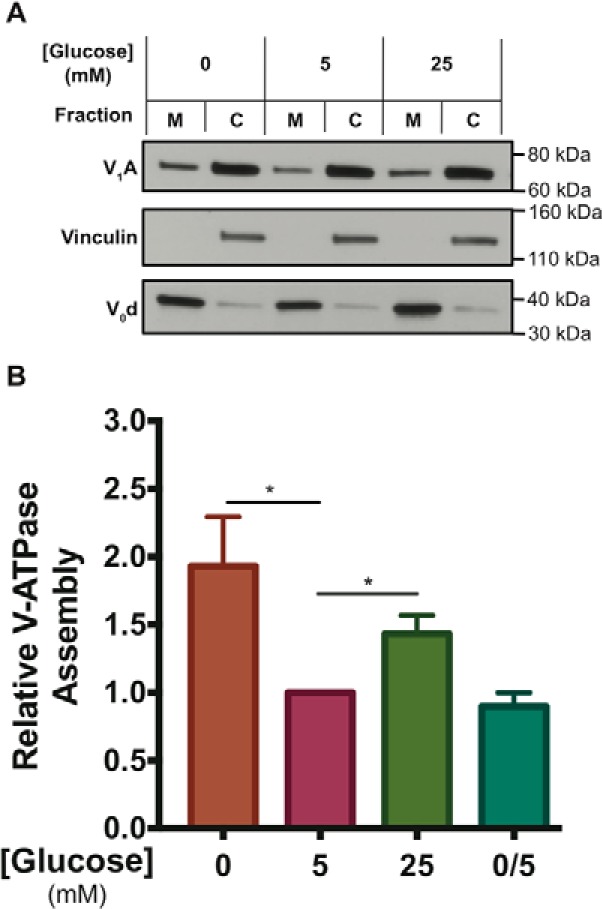
Figure 1.

Incubation of HEK293T cells at low or high glucose increases V-ATPase assembly relative to physiological concentrations. A, HEK293T cells were maintained in serum-free DMEM containing 5 mm (physiological) glucose for ∼6 h and then treated with serum-free DMEM containing 0 mm glucose (10 min), 5 mm glucose (1 h), 25 mm glucose (1 h), or 0 mm glucose (10 min) followed by 5 mm glucose (10 min). Incubation at high glucose was performed for longer times to allow comparison with previously published results (16–18). Following treatment, cells were fractioned into membrane (M) and cytosolic (C) fractions as described under “Experimental procedures.” Samples were subjected to SDS-PAGE and Western blotting using an antibody against subunit A of the V1 domain as a measure of assembly. Antibody staining of subunit d of the V0 domain was used as a loading control for the membrane fraction, and staining for vinculin was used as a loading control for the cytosolic fraction. The quantity of subunit A present in the membrane fraction is an indication of the level of V-ATPase assembly. Shown is a representative Western blotting. B, Western blots performed as described in A were quantified using ImageJ software to determine the amount of V-ATPase assembly. Band intensities of subunit A in the membrane fraction were normalized to band intensities of the membrane loading control (subunit d). Results were then normalized to the baseline assembly levels observed at 5 mm glucose, which was defined as 1.0 for each individual trial. We find that the actual fraction of membrane bound versus cytosolic V1 is 0.33 ± 0.16 (n = 6) in HEK293T cells under normal physiological glucose concentrations (5 mm). Relative to the degree of assembly at 5 mm glucose (defined as 1.0 for this comparison), the average level of assembly for cells treated with 0 mm glucose was 1.9 ± 0.5 (p < 0.02, n = 9), whereas the average level of assembly for cells treated with 25 mm glucose was 1.4 ± 0.1 (p < 0.02, n = 5). Glucose re-addition for 10 min after starvation (labeled 0/5) returned assembly levels to 0.9 ± 0.1 (n = 3). The error bars represent standard error. The asterisks indicate statistically significant differences at the indicated p values.
