
Figure 3.
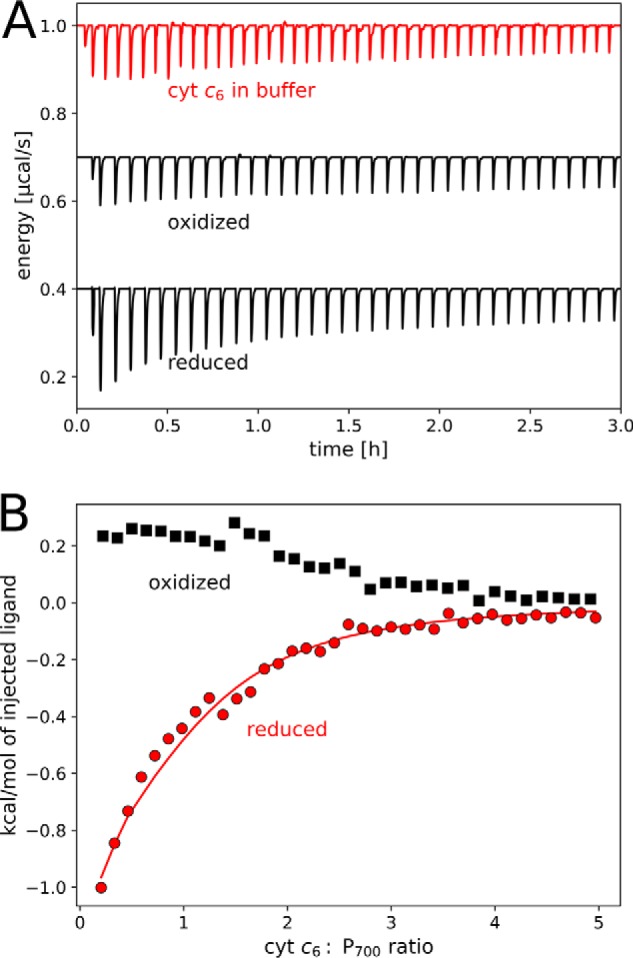
Isothermal titration calorimetry of PS I with cyt c6. A, thermogram for exemplary background measurements (top, red) and oxidized (middle) and reduced (bottom) proteins. B, integrated heats of titrations after background subtraction in the presence (red; reduced) or absence (black; oxidized) of 5 mm ascorbate. The fit of the data for reduced cyt c6 is shown for one set of binding sites with n = 1.0. Parameters obtained from the model are shown in Table 2. After substraction of the heat of dilution, the data for oxidized cyt c6 converge to negative values at high cyt c6:PS I ratio (−0.1 kcal/mol; not shown) and are thus not analyzed by a model. Measurements were performed at 20 °C in 25 mm Tricine-NaOH, pH 8.0, with 25 mm NaCl and 0.02% DDM. Each titration step consisted of a 5-μl injected volume from 1 mm cyt c6.