Figure 2.

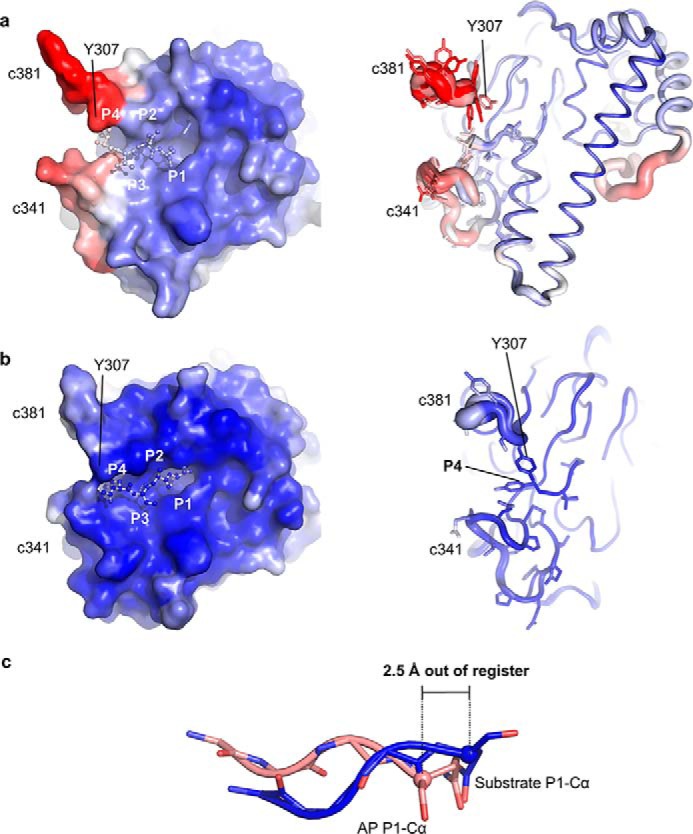
Substrate recognition in the fully activated AtLEGγ (AEP) form differs from the activation peptide (AP) binding in the zymogenic two-chain state with respect to both structure and dynamics. Surface (left) and cartoon representations are used to color code the conformational variabilities by their crystallographic temperature factors. The color spectrum from blue to red represents low to high conformational variability, i.e. rigid (blue) to flexible (red). a, note the high temperature factors and multiple conformations of the specificity loops c341 and c381 in the zymogenic two-chain state. b, the fully activated catalytic domain shows well-ordered specificity loops. c, structural superposition of the activation peptide of the zymogenic two-chain state (AP) in orange and the substrate Ac-YVAD in blue. Note the shift in register of around 2.5 Å at the P1 Cα positions.
