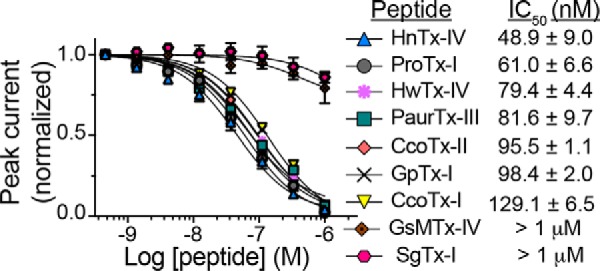
Figure 7.

GMT inhibition of NaV1.7. Automated whole-cell patch-clamp electrophysiology was used to compare the inhibitory potency of the peptides at NaV1.7. Representative concentration–response curves and comparative IC50 values for the peptides are shown. Data are mean ± S.E. (error bars), where n = 3 and one cell was considered an independent experiment.
