Figure 5.

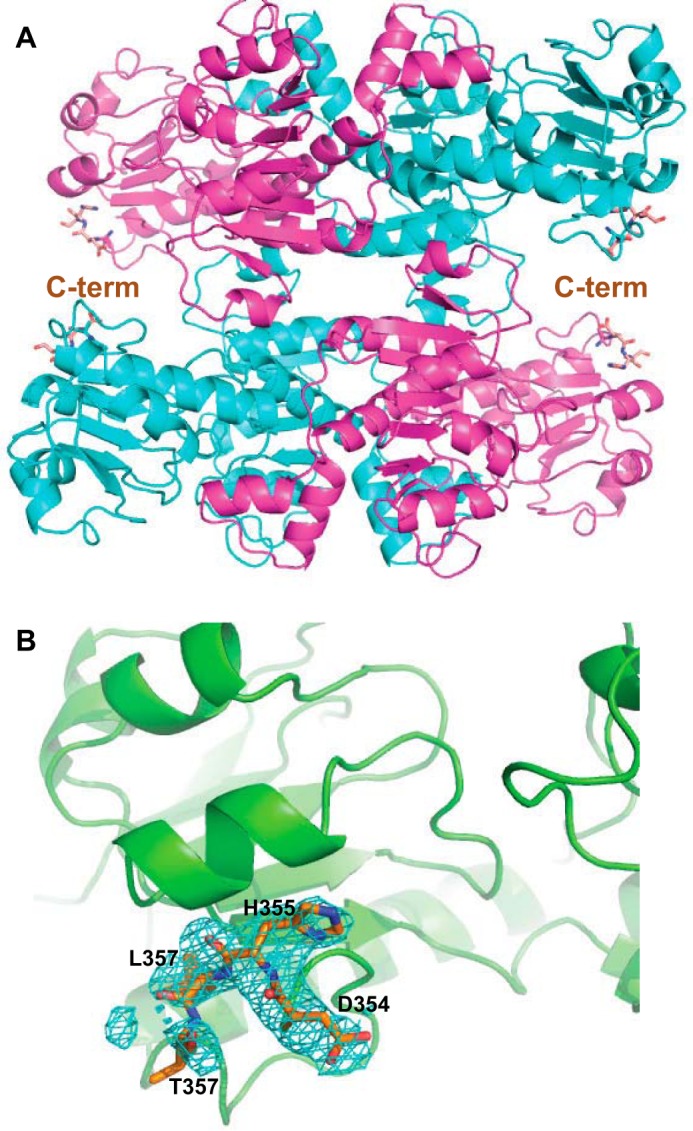
Crystal structure of CtBP1(28–378). A, trace of the CtBP1 tetramer, with two subunits in magenta and two in cyan. Shown with orange carbon atoms is a stick rendition of the additional four residues observed compared with the previous CtBP1(28–353) structures. B, Fo − Fc difference electron density map shown in cyan at a +2σ level for the four additional residues (Asp354–Thr357) observed.
