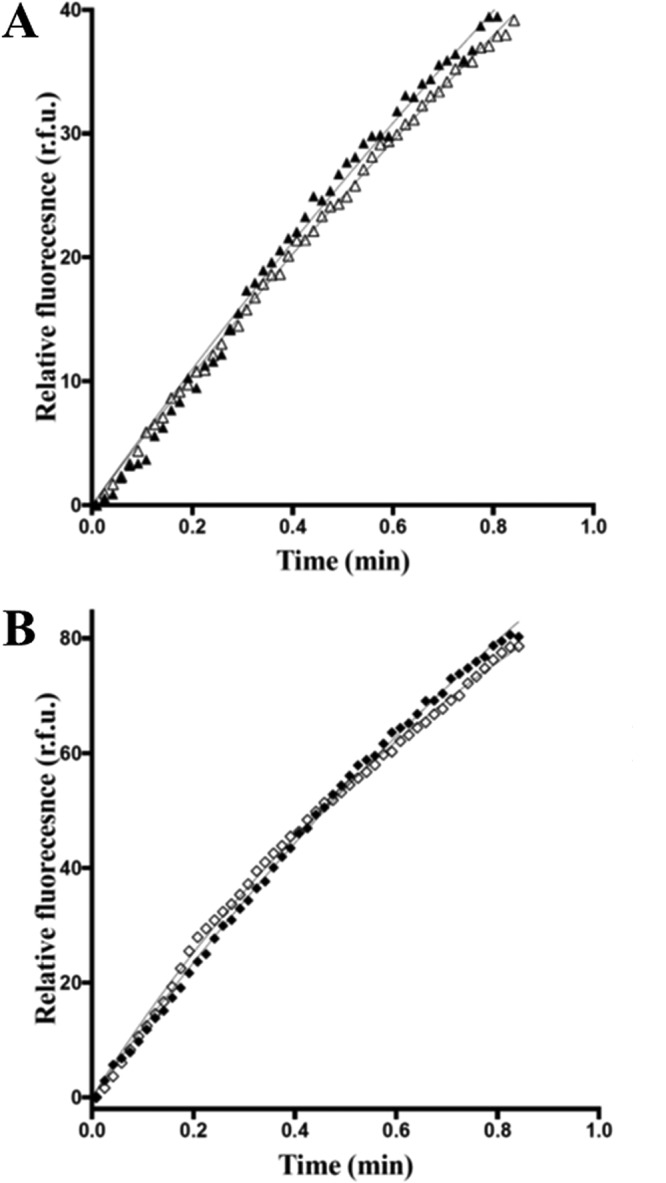
Figure 12.

Biochemical characterization of GTP/GDP exchange activities for GEF3/RhoA and GEF12/RhoA complexes. A, GEF3-mediated RhoA GTP/GDP exchange reaction is not inhibited by 0. 5 mm inhibitor peptide 102–106. RhoA exchange activity was measured in the presence of GEF3 (10 μm; dark triangles) or in the presence of both GEF3 (10 μm) and peptide 102–106 (0.5 mm; open triangles). B, GEF12-mediated RhoA GTP/GDP exchange reaction is not inhibited by 0.5 mm inhibitor peptide 102–106. RhoA exchange activity was measured in the presence of GEF12 (0.05 μm; dark squares) or in the presence of both GEF12 (0.05 μm) and peptide 102–106 (0.5 mm; open squares). The experiments were run at least three times independently. A representative curve is presented here. r.f.u., relative fluorescence units.
