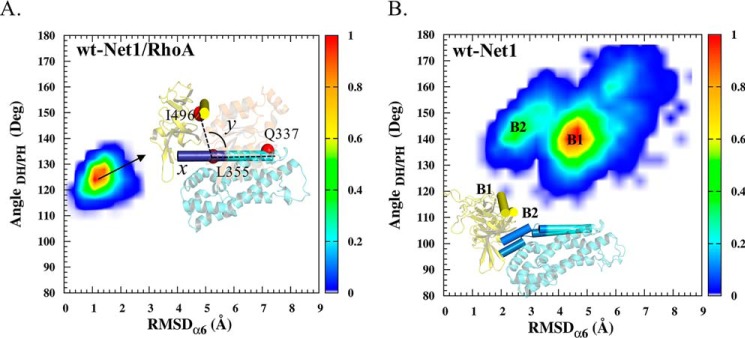
Figure 6.
Conformational distributions of the DH/PH domains of Net1. Molecular dynamics results show the r.m.s.d. of the α6 helix (residues 357–368) on the x axis (Å), and the DH/PH angle (i.e. the angle between the α-carbons of residues Gln337, Leu355, and Ile496) on the y axis (deg, degrees). Each plot shows representative structures of Net1; the α6 and αC helices are shown in cyan and yellow cylinders, respectively. The color scale indicates the number of occurrences per bin normalized to the maximum number in a bin. A, Net1 in complex with RhoA. B, Net1 in the absence of RhoA.

