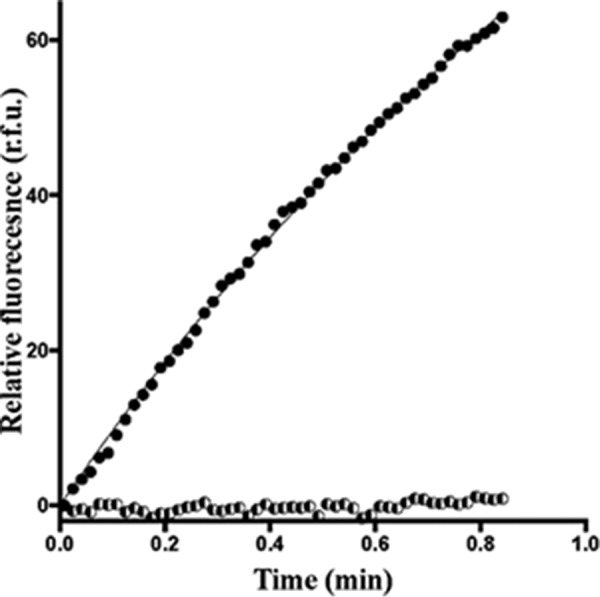
Figure 7.

Biochemical characterization of GTP/GDP exchange activities for the Net1/RhoA complex. RhoA exchange activity was measured in the presence of the DHPH segment of Net1 (1 μm; dark circles). The GTP/GDP exchange activity of Net1 DH (10 μm) is shown as a control experiment (halftone symbols). The experiments were run at least three times independently. A representative curve is presented here. r.f.u., relative fluorescence units.
