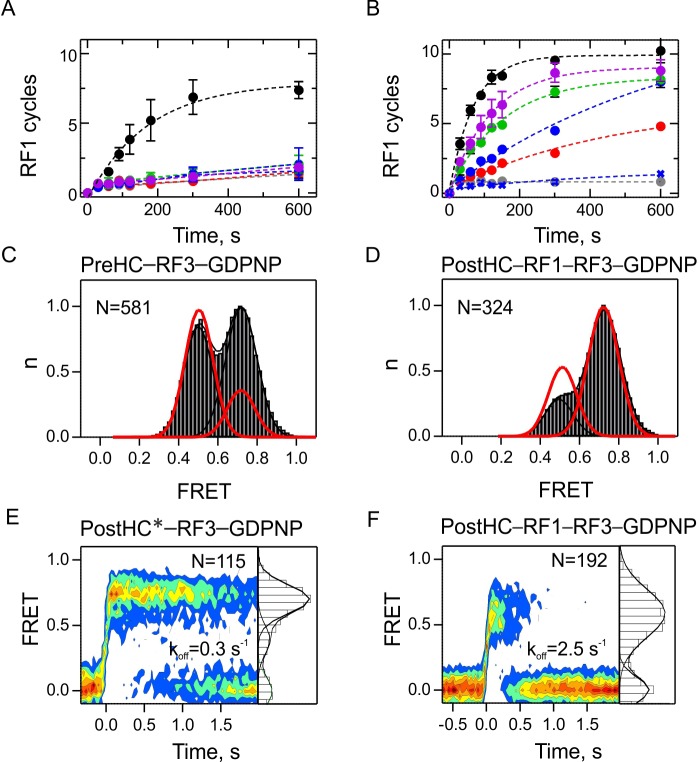
Figure 6. The role of GTP hydrolysis for RF1 and RF3 recycling.
(A,B) Effect of different nucleotides on peptidyl-tRNA hydrolysis (GTP, black circles; GTPγS, green circles; GDPNP, blue circles; GDP, red circles; no nucleotide, grey circles) or in the presence of RF3(H92A) and GTP (purple circles). Control experiments are in the absence of RF3 (blue crosses). Error bars represent the range of two technical replicates. (A) Peptide hydrolysis was performed by incubating PreHC (100 nM) with RF3 (10 nM) and the respective nucleotides (1 mM); reactions were started with the addition of RF1 (10 nM). (B) Same as in (A), but at 1 µM RF3. (C,D) FRET distribution reporting on subunit rotation of S6/L9-labeled PreHC in the presence of saturating amounts of RF3–GDPNP (C) or RF1 with RF3–GDPNP (D) (1 µM RF each). Red lines represent the distribution of FRET states with RF3–GTP. (E,F) Contour plots representing the residence time of RF3-Cy5 (10 nM) on PostHC labeled at L11 by Cy3 in the presence of GDPNP (1 mM) without RF1 (E) or (F) in the presence of saturating RF1 concentration (1 µM). FRET values (mean ± sd) center at 0.71 ± 0.01 and 0.40 ± 0.01 (E) and 0.58 ± 0.03 (F). All values are mean ± sd from three independent data sets. See also Figure 6—figure supplement 1, Figure 6—figure supplement 2 and Supplementary file 1.


