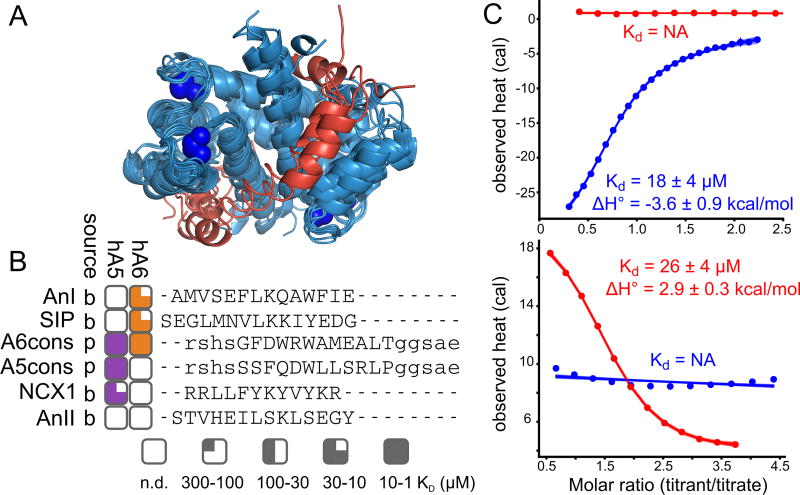
Fig 1. Human S100A5 and S100A6 exhibit peptide binding specificity.
A) Published structures of S100 family members bound to both Ca2+ and peptide targets at the canonical hydrophobic interface (PDB: 3IQQ, 1QLS, 3RM1, 2KRF, 4ETO, 2KBM, 1MWN, 3ZWH). Structures are aligned to the Ca2+-bound structure of human S100A5 (2KAY). Peptides are shown in red. Blue spheres are Ca2+ ions. B) Binding specificity of hA5 and hA6. Peptide names are indicated on the left. “Source” column indicates whether the peptide is derived from a biological target (“b”) or phage display (“p”). Boxes indicate the affinity of the peptide for hA5 (purple) and hA6 (orange). Degree of fill indicates KD: empty (no detectable binding), quarter (300 < KD ≤ 100 µM), half (100 < KD ≤ 30 µM), three-quarter (30 < KD ≤ 10 µM), or filled (10 < KD ≤ 1 µM). Peptide sequences, aligned using MUSCLE (61), are shown on the right. Solubilizing flanks, which contribute minimally to binding (Table S2), are shown in lowercase letters. Annexin 1 (AnI) and Annexin 2 (AnII) binding measurements are from a published study (35). C) ITC heats for the titration of NCX1 (blue) and SIP (red) peptides onto hA5 (top) and hA6 (bottom). Points are integrated heats extracted from each shot. Lines are 100 fit solutions drawn from the fit posterior probability distributions. For the hA5/NCX1 and hA6/SIP curves, we used a single-site binding model. For hA5/SIP and hA6/NCX1, we used a blank dilution model. Fit KD and binding enthalpies are indicated on the plots, along with standard deviation of the posterior probability distribution for that parameter. Full thermodynamic parameters for these fits are in Table S3–S6.

