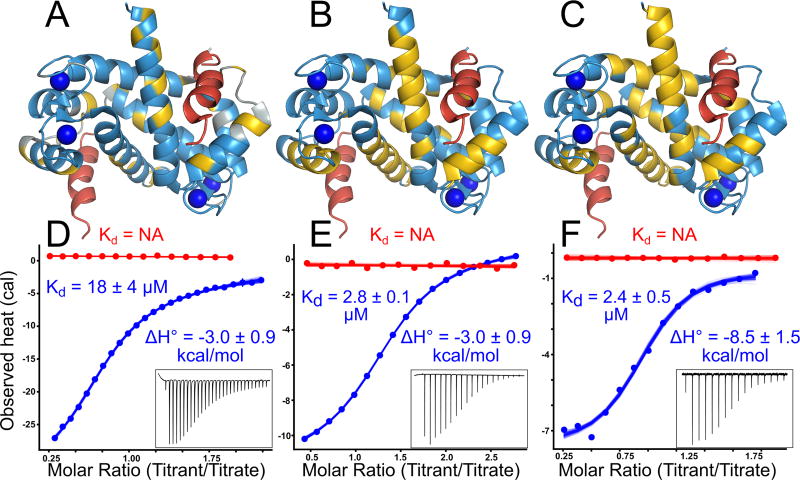
Fig 2. Diverse peptides bind at the human S100A5 peptide interface.
Structures show NMR data mapped onto the structure of Ca2+-bound hA5 (2KAY (48)). To indicate the expected peptide binding location, we aligned a structure of hA6 in complex with the SIP peptide (2JTT (41)) to the hA5 structure, and then displayed the SIP peptide in red. Panels A–C show binding for NCX1, A5cons, and A6cons respectively. In panel A, yellow residues are those noted as responsive to NCX1 binding in (42). In panels B and C, yellow residues are those whose 1H – 15N TROSY-HSQC peaks could not be identified in the peptide-bound spectrum because the peaks either shifted or broadened relative to the spectrum without peptide. Panels D–E show ITC data for binding of the peptides above in the presence of 2 mM Ca2+ (blue) or 2 mM EDTA (red). Points are integrated heats extracted from each shot. Lines are 100 different fit solutions drawn from the fit posterior probability distributions. For the Ca2+ curves, we used a single-site binding model. For the EDTA curves, we used a blank dilution model. Fit KD and binding enthalpies are indicated on the plots, along with standard deviation of the posterior probability distribution for that parameter. Insets show baseline-corrected ITC power traces for the Ca2+ binding curves. Full thermodynamic parameters for these fits are in Table S3–S6.

