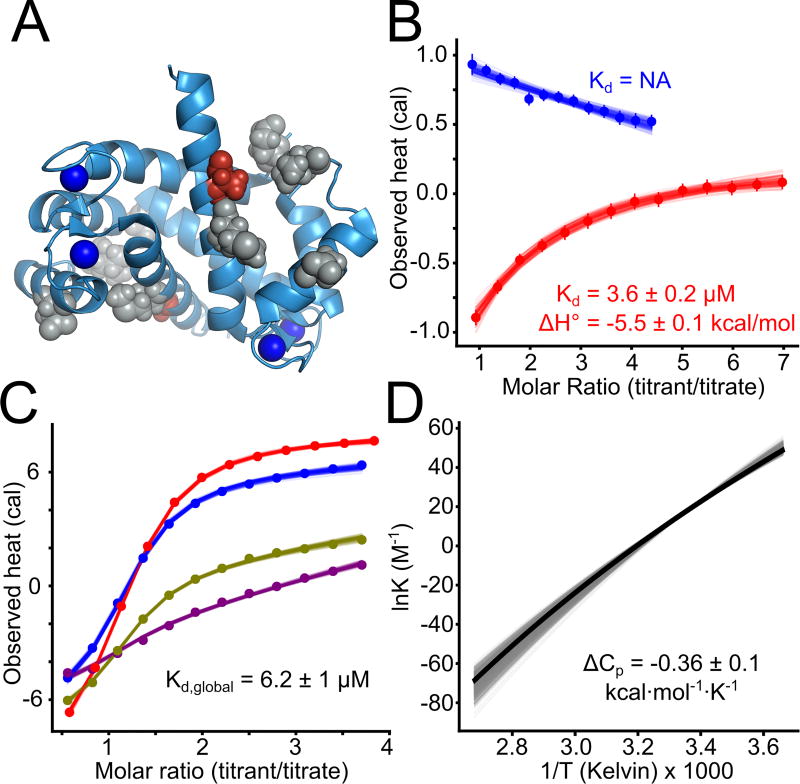
Fig 5. Small changes are sufficient to alter binding specificity at the interface.
A) Ca2+-bound structure of human S100A5 (2KAY) (48) with ancestral reversions marked in gray (no effect on SIP binding) and red (A83, which causes SIP binding). Blue spheres are Ca2+ ions. B) ITC traces showing titration of SIP onto hA5 A83m (red) versus wildtype hA5 (blue). Points are integrated heats extracted from each shot. Lines are 100 different fit solutions drawn from the fit posterior probability distributions. For the hA5/A83m curve, we used a single-site binding model. For the hA5 curve, we used a blank dilution model, where the linear slope is indicative of peptide dilution without binding. Fit KD and binding enthalpy is indicated, along with standard deviation of the posterior probability distribution for that parameter. Full thermodynamic parameters for these fits are in Table S7. C) ITC traces for titrations of A5cons onto hA5 for as a function of temperature: 10°C (purple), 15°C (green), 20°C (blue), and 25°C (red). Points are integrated heats extracted from each shot. Lines are 100 different fit solutions drawn from the fit posterior probability distributions for a global Van’t Hoff model optimized on all four experiments simultaneously. The Maximum Likelihood value of the KD from the global fit is indicated on the plot. D) Van’t Hoff plot showing temperature dependence of ln(K) determined from global fit in panel C. Thick black line shows Maximum Likelihood curve, gray lines are 500 curves drawn from the posterior distribution of the Bayesian fit. The Maximum Likelihood value of ΔCp is indicated on the plot.

