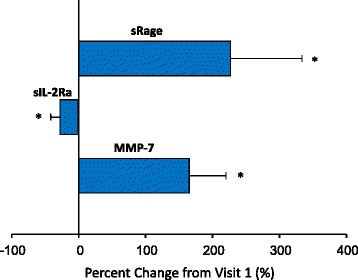
Fig. 5.

Plasma profiling changes from Visit 1 to last available visit in AC treated patients. The relative change in ECM and inflammatory pathways were computed as a function of Visit 1 and the final visit in the AC treated patients. Those with a significant shift from Visit 1 are shown here and identify that continued shifts in determinants of inflammatory signaling and ECM remodeling occurred at later AC treatment time points. (*p < 0.05 vs Visit 1 values)
