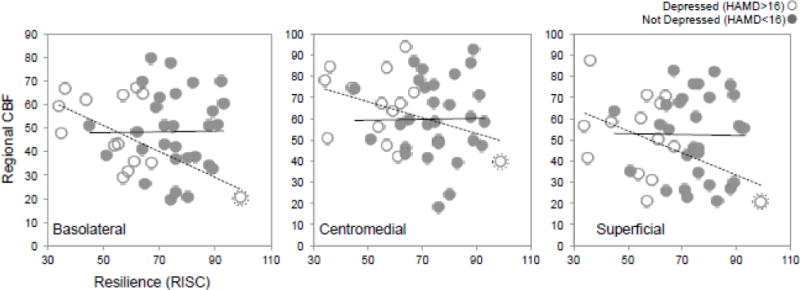
Figure 2. Resilience Scores Correlate with Amygdala Function Measured with ASL fMRI.

Mean cerebral blood flow (CBF, y axis) is plotted for the basolateral (left), centromedial (middle), and superficial (right) nuclei for each volunteer with respect to resilience scores (x axis), averaged across hemisphere. Depressed and nondepressed groups are shown in open and closed circles respectively. Regression fit lines are also displayed for depressed and nondepressed groups in dotted and solid lines respectively. Note that a potential outlier was identified, and is marked by an enclosing dotted circle.
