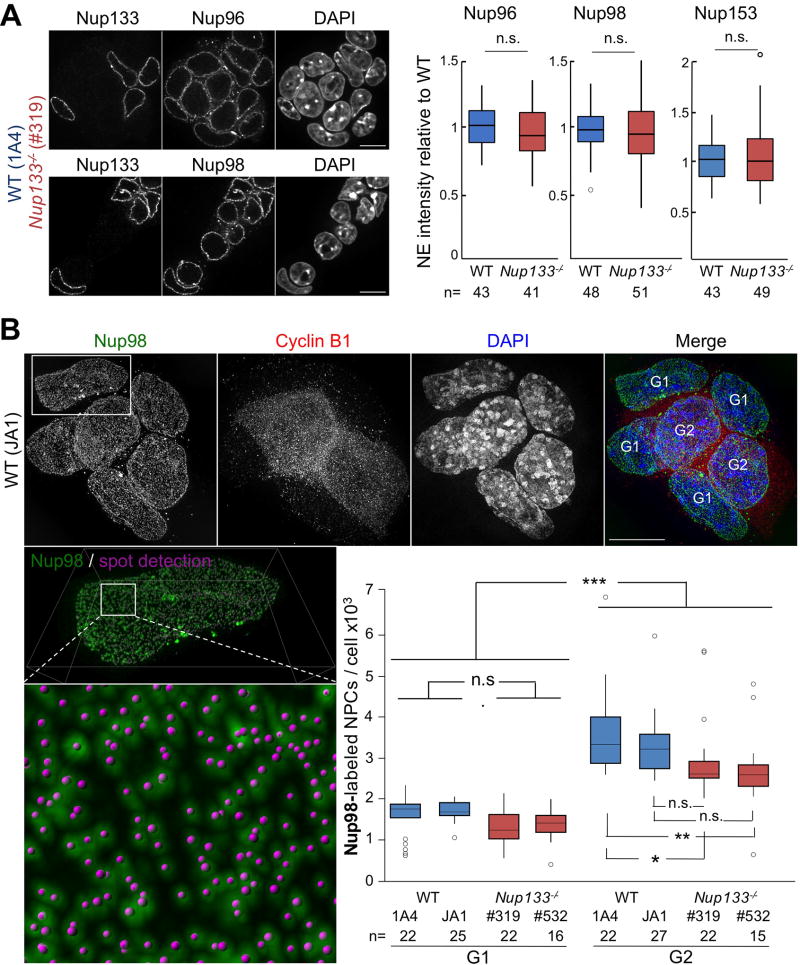
Figure 1. NPC assembly appears unaltered in Nup133-deficient mESCs.
A. Left; representative spinning disk images (one z-section) of co-cultured WT (1A4) and Nup133−/− (#319) mESCs stained for DAPI, Nup133 and Nup96 (top) or Nup98 (bottom); bar 10µm. Right; Signal intensities for Nup96, Nup98 and Nup153 at the NE in WT (1A4) and Nup133−/− (#319) mESCs were quantified for n cells from ⪰ two independent experiments and normalized to the average for WT nuclei in the same field. B. Top; representative 3D-SIM images of WT mESCs stained for Nup98, Cyclin B1 and DAPI, bar 10µm. Bottom left; enlarged views of the NE surface of a G1 cell show Nup98-labeled NPCs and the corresponding spots defined as individual NPCs by Imaris. Bottom right; Imaris-based quantification of the total number of Nup98-labelled NPCs in WT (1A4, JA1) and Nup133−/− (#319, #532) mESCs in G1 and G2 (see Methods).

