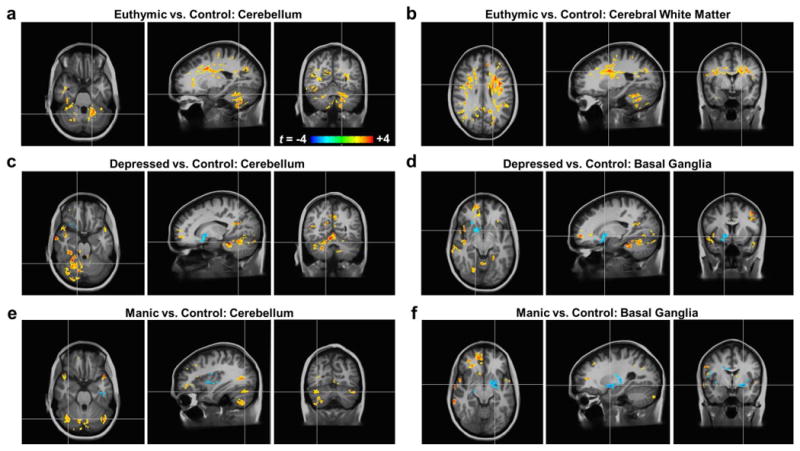
Figure 1.

Participants with bipolar disorder have altered mood-state-dependent T1ρ relaxation times in the cerebellum, basal ganglia, and cerebral white matter compared to healthy controls. All brain images show t-score maps of the statistically-significant (p<0.05) voxel-wise differences in T1ρ relaxation times between the (a,b) euthymic, (c,d) depressed, and (e,f) manic groups versus the healthy control group. The statistical maps are overlaid on the average of all N=81 T1-weighted anatomical images in the common atlas space. In the euthymic state, only increased T1ρ relaxation times were found, primarily in the cerebellum (a) and cerebral white matter (b). In the depressed state, increased T1ρ relaxation times were again seen in the cerebellum (c). Additionally, reduced T1ρ relaxation times were found in portions of the right basal ganglia (d). In the manic state, cerebellar T1ρ relaxation times were also increased (e). Similar to the depressed state, regions near the left basal ganglia had reduced T1ρ relaxation times (f).
