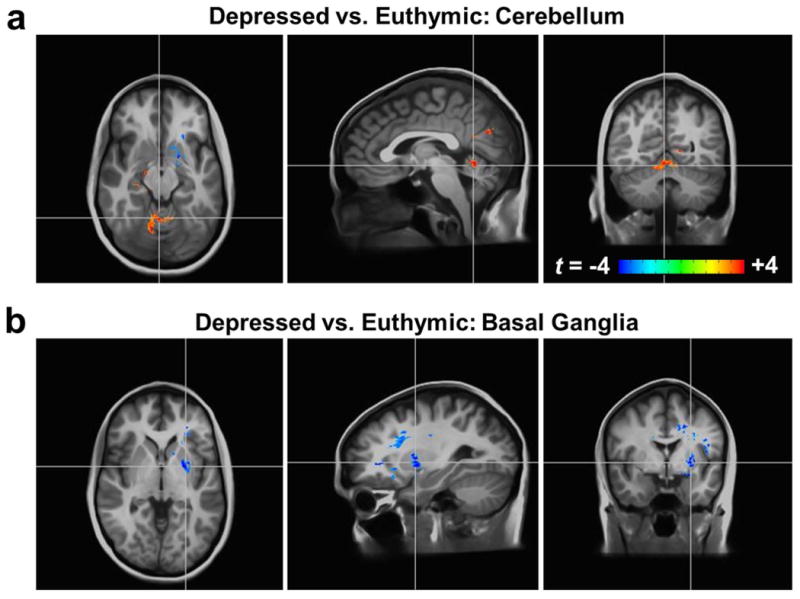
Figure 2.

T1ρ relaxation times differ between participants with bipolar disorder in a depressed mood state compared to those in a euthymic state. All brain images show t-score maps overlaid on the average anatomically-aligned T1-weighted images as in Figure 1. The depressed group had (a) increased T1ρ relaxation times in the cerebellum and (b) reduced T1ρ relaxation times in the basal ganglia (p<0.05).
