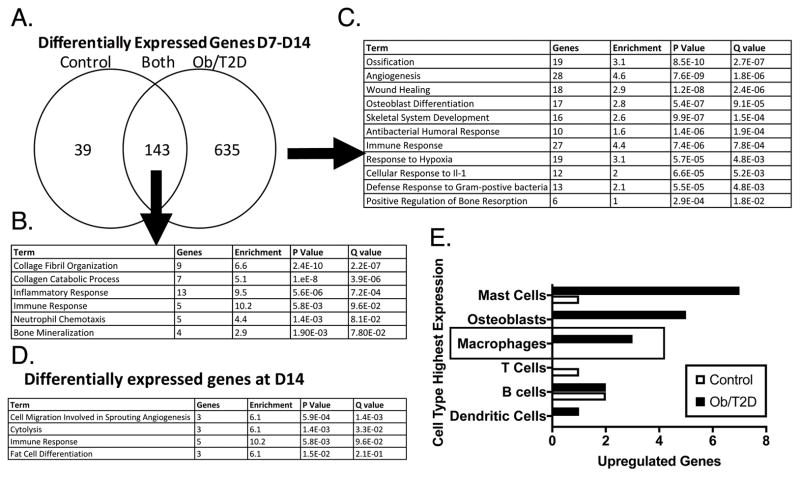
Figure 2. RNA sequencing and pathway analysis in infected bone indicate enrichment in terms associated with inflammation and ossification in obese/T2D mice.
Obese/T2D mice and control mice were infected as before and harvested at days 7 and 14 post-infection. Infected tibiae were isolated, homogenized, RNA isolated, and RNAsequencing was performed. A. The number of changed genes from day 7 to day 14 in control mice only, obese/T2D mice only, and control and obese/T2D. B. Enriched pathways represented by the 143 genes differentially expressed in both obese/T2D and control mice. C. Enriched pathways represented by the 635 genes differentially expressed in obese/T2D mice. D. Pathways represented by differentially expressed genes between obese/T2D and control mice at day 14. E. The 25 genes with the greatest change were mapped to the cell type most likely to express the gene using BioGPS. Genes associated with macrophages and osteoblasts were more highly enriched in obese/T2D mice compared to control mice. n = 3 mice per group.

