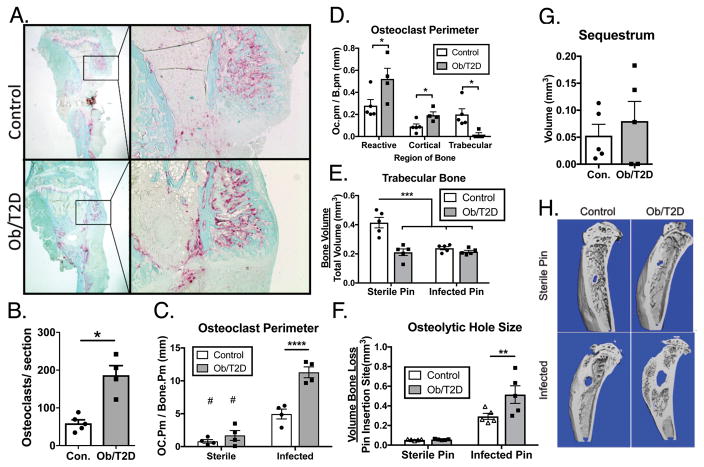
Figure 5. Increased osteoclast activity and osteolysis in infected tibiae of obese/T2D mice.
Infected tibiae from obese/T2D and control mice were harvested at day 21. A. tartrate-resistant acid phosphatase staining of histologic sections. B. the number of osteoclasts per section was quantified. C. Osteomeasure software was used to quantitate total perimeter of osteoclast (Trap+), and D. Trap+ staining in each bone compartment. μCT was used at day 21 to quantify E. total trabecular bone, F. osteolytic hole size at the pin insertion site, and G. sequestrum (infected necrotic bone). H. Representative μCT scans at day 21 post-infection. * p <.05, ** p<.01, *** p <.001. # p <.001 when compared to infected counterpart. #p<.001, $ p<.0001 when comparing non-infected control to infected. Unpaired T-test was used for B, D, and H. Two way ANOVA was used for C, E, and G with Bonferoni correction. n = 4 – 5 mice per group. Each point represents one mouse.

